Dollar Index technical outlook
With US data generally improving and other central banks growing more dovish, the pressure is building on the dollar to rise further as speculation about […]
With US data generally improving and other central banks growing more dovish, the pressure is building on the dollar to rise further as speculation about […]
With US data generally improving and other central banks growing more dovish, the pressure is building on the dollar to rise further as speculation about another rate increase from the Federal Reserve later this year grows. The weakness in the US jobs market at the start of the summer proved to be a blip rather than a change in the trend. Other macro pointers from the world’s largest economy have generally been positive, too. This week we will find out – in the form of retail sales and consumer sentiment data on Friday, and retail earnings results throughout this week – whether the strength in the labour market has been strong enough for the American consumers to loosen up their purse strings. If so, one would think that both the US dollar and equity prices will be able to extend their gains. Ahead of these figures, the dollar has pulled back a touch, allowing the EUR/USD and the like to stage a short-covering bounce today.
On the technical front, the Dollar Index (DXY) is bang in the middle of its 1.5-year consolidation range, holding near its flattening 50-week moving average. From a long-term point of view, the lengthy consolidation here is actually quite bullish given that the prior move was a rally that began in mid-2014 and that the index has been able to hold on to most of those gains. Indeed, the difference between the base (92/93) and ceiling (100) of this range has only been about 700-800 pips, which is insignificant over such a long period of time. Thus a bullish breakout, if and when seen, would point to a significant continuation in the upward trend.
But while contained within its ranges, the DXY should be treated and traded differently as opposed to a trending market. A range-bound market is definitely tradable but it requires the speculator to first recognise it and then adapt an appropriate strategy when it comes down to trading it. Unlike trending markets, in these conditions both the bulls and bears can find decent short-term trading opportunities. As short-term technical levels carry more weight, it is not a bad idea, for example, to book profits quicker and look for false breakout and breakdown patterns. Also, buying as close to support and selling as close to resistance as possible is vital – especially in ranging market conditions, as you don’t want to be caught and remain offside for a long period of time.
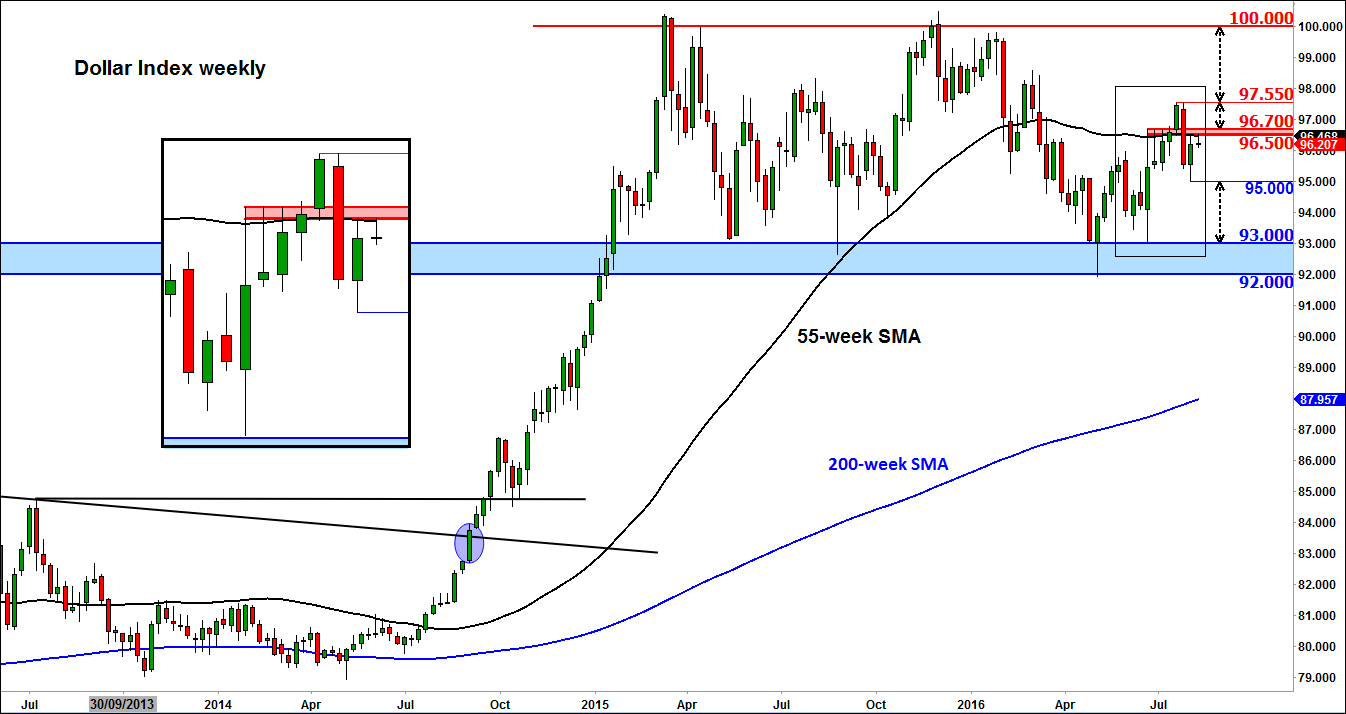
So with that in mind, one can understand why the dollar has been unable to sharply extend its gains even though the US monthly jobs report came out significantly stronger than expected last Friday. Specifically, the DXY’s advance has been rejected this week at around the key short-term technical area of 96.50/70, which was previously support and resistance. This level also roughly marks the mid-point of the long-term range, which is important to note.
The 96.50/70 area and other short-term technical levels are clearly defined on the DXY chart, below. For as long as resistance around this 96.50/70 area holds, the short-term path of least resistance would be to the downside. And If and when 95.00 breaks down then a revisit of the long-term range lows around 92/93 would then become likely. But given the long-term bullish bias, a break above 96.50/70, if seen, could be more eye-catching as this could lead to a revisit and potentially a break above the height of the range at 100.