DJIA Stock market recovery fades but was that it
Equities have surged higher this week, surprising many traders and analysts who were preparing for a stock market crash. Heavily-shorted stocks led the rally as […]
Equities have surged higher this week, surprising many traders and analysts who were preparing for a stock market crash. Heavily-shorted stocks led the rally as […]
Equities have surged higher this week, surprising many traders and analysts who were preparing for a stock market crash. Heavily-shorted stocks led the rally as the sellers scrambled to book profit on their positions. The resulting gains saw Wall Street log its first three-day rally of the year. Today, traders are making a more sober assessment of the situation. They know full well that bear market rallies tend to be vicious and can last from several days to several weeks. The continued rise of safe haven gold and yen suggests sentiment is still shaky and that the stock market recovery may well have been just an oversold bounce. But rallies start with short covering anyway and the fact that several key resistance levels have broken down already means the recovery may continue for a few more days yet. After all, crude oil is trying to form a long-term base, though so far the bulls have not been successful. In fact both oil contracts fell sharply this afternoon after the US Department of Energy reported a disappointing set of stockpiles data which showed stocks of oil and oil products rose across the board last week. So, the wait for a strong reversal signal continues. Nevertheless, the potential for a stronger oil price recovery is there if large oil exporters agree to freeze their production at January levels and/or US oil output starts to fall noticeably now. What’s more, the Fed’s January meeting minutes and speeches from several FOMC members suggests the Fed may delay upcoming rate hikes. Meanwhile other central banks such as the BoJ and ECB have turned even more dovish. Thus, if more central bank stimulus is introduced then this could boost the appeal of higher-yielding equities.
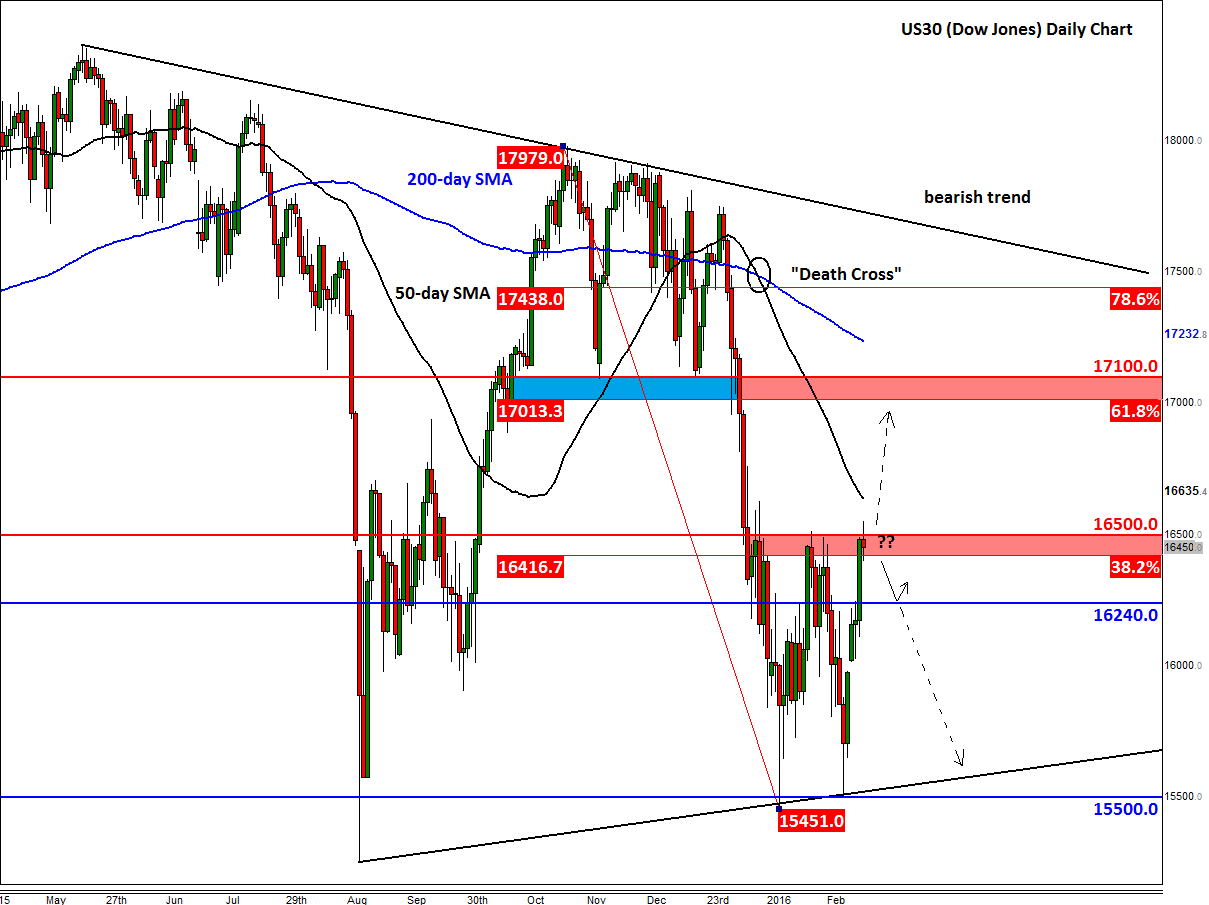
But as you can probably sense from the above paragraph, I too am very cautious whether to call this a short-covering bounce or the start of a much larger recovery. As a technical analyst and trader, I let the charts guide me in terms of near term direction, especially when I am not so sure about the fundamental outlook. Today’s price action has certainly been bearish thus far, which makes sense after a three or four day recovery in a downward trend. Some of the major indices have also reached or neared key resistance levels. The Dow for one has reached a key technical area between 16415 and 16500 today. As can be seen from the daily chart, below, this is where the 38.2% Fibonacci retracement level of the drop from the November high converges with previous resistance. Thus, what happens here could determine the direction for the next several trading days. If resistance holds here, then there is a possibility for the downward trend to resume after this week’s sharp bounce. Conversely, a clean break above this range could pave the way for a more profound recovery. Conservative speculators may therefore want to wait for the market to decide on direction and then trade in the direction of the breakout.
If the Dow manages to break above the aforementioned resistance area then there are not a lot of further hurdles to derail the potential rally (except the 50-moving average at 16635) until the 17010-17100 range. This area was previously support and corresponds with the key 61.8% Fibonacci retracement level. Of course, that’s not to say that the Dow will reach this area. It may or may not do; in any case, the 17010-17100 range merely represents a reference point where I would expect to see lots of trading activity around, should we get there.
On the other hand, if resistance holds and the Dow turns lower from this 16415-16550 range then there are not a lot of reference points to watch on the way down, apart from 16240 and round handles such as 16000 – at least not on the daily time frame, anyway. So the potential for a sharp follow-through selling pressure is there. The key long-term support resides around 15500 where we also have a rising trend line in place now. Needless to say, a potential break below this level would be a very bearish outcome as far as the long-term trends are concerned.