


Did Tesla Just “Ring the Bell” on the Nasdaq 100’s Bull Run?
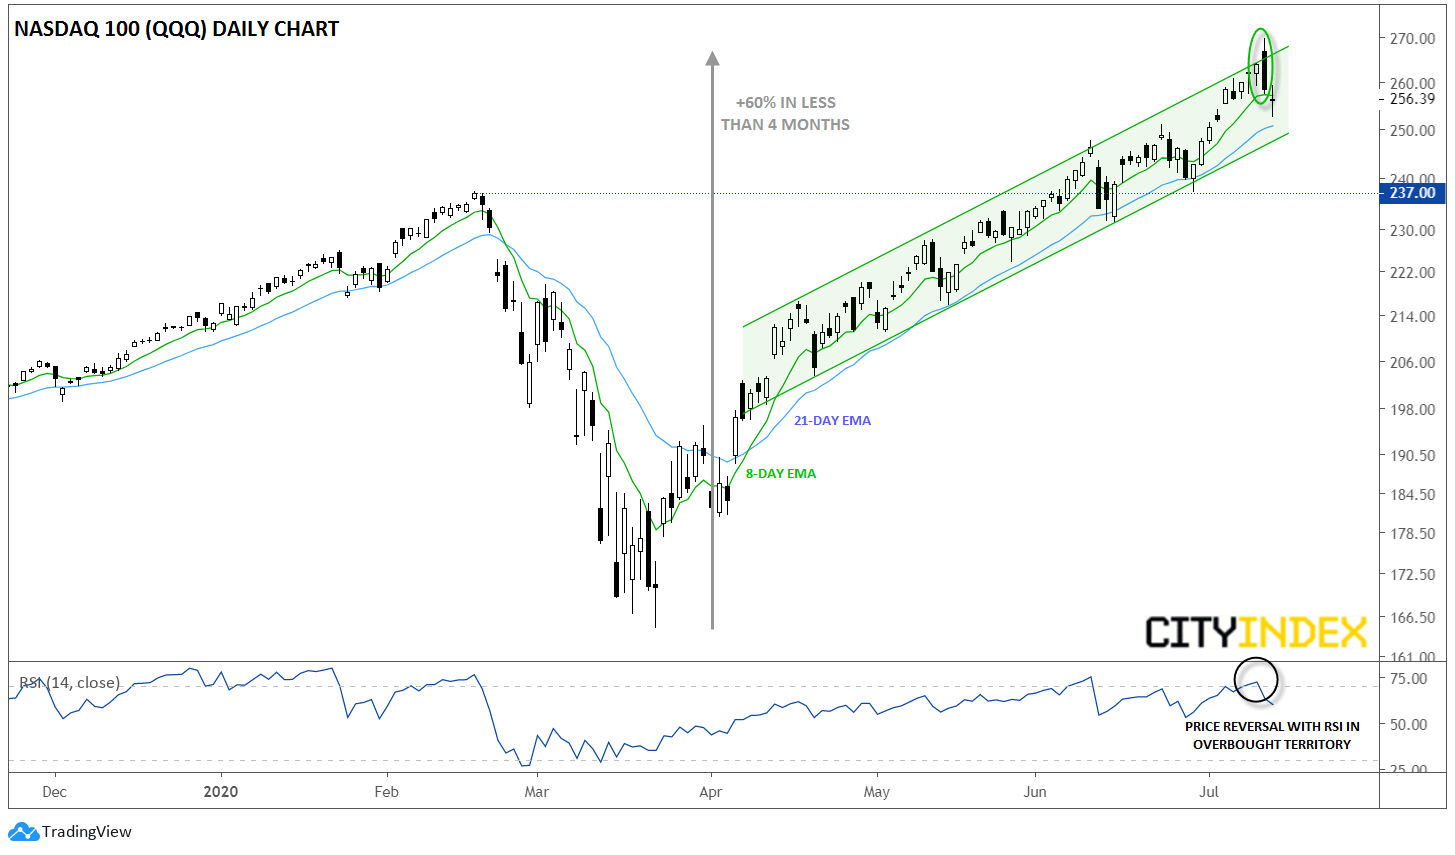
“Nobody rings a bell at the market top” is a common market refrain that underscores how difficult it can be to identify the end of an uptrend in real time. Just in the past few months alone, we’ve seen the Nasdaq 100 shrug off countless bearish divergences, absurd valuations, and economic disconnects on its way to hit all-time highs, despite the ongoing global COVID-19 pandemic. In fact, at yesterday’s high, the index had gained more than 60% from its intraday pandemic trough in less than four months!
Source: Tradingview, GAIN Capital
Over this period, no single stock has better captured the risk appetite zeitgeist than Elon Musk’s electric car manufacturing firm Tesla (TSLA), which more than quadrupled (+400%) from its March low to yesterday’s peak to become one of the ten largest publicly traded US companies by market capitalization, briefly propelling Musk toward the top of the global “rich list.”
Of course, yesterday saw a sharp reversal in both the Nasdaq 100 and its most iconic stock holding, with Tesla shedding nearly -20% (a “bear market” if we can apply to an individual stock) from its intraday peak on Monday alone. As of writing on Tuesday morning, both the index and Tesla are losing additional ground, prompting traders to ask: Has TSLA’s big reversal has rung the proverbial bell for the Nasdaq’s unstoppable bull run?

Source: Tradingview, GAIN Capital
From our perspective, the short-term price action is certainly a worrisome sign for bulls. Technically speaking, both Tesla and the Nasdaq 100 have formed bearish candlestick patterns in overbought territory on the RSI indicator. Meanwhile, from a fundamental perspective, the firm is trading at an astronomical 250X forward P/E ratio, with an “acquirer’s multiple” (EV/EBITDA) above 80. At this point, the stock is undoubtedly priced for perfection; even if Tesla is able to capture the vast majority of the electric car market over the next decade, it may still take years for business operations to “catch up” to its valuation.
That said, the narrative driving TSLA has never been about valuations. Instead, it’s one of the purest measures of investors’ risk appetite on the planet right now. While it can be tempting to try to short such “obviously overvalued” stocks, many bears said the same thing at $600, $800, $1000, $1200, and $1400. In other words, who’s to say TSLA can’t go above $2,000, especially if there’s positive news in the fight against the virus or hints of additional fiscal/monetary stimulus to support the economy? It absolutely could.
In these types of parabolic moves, short-term technical trend following can often be the best strategy to limit risk and maximize potential gains in both directions. For example, traders could watch the short-term 8- and 21-day exponential moving averages as measures of the near-term trend. As long as TSLA and the Nasdaq 100 are holding above these smoothed measures of the recent trend, long positions would be favored. Meanwhile, if TSLA or the Nasdaq 100 break below these smoothed measures of the recent trend, it could be a signal that risk appetite is fading and a significant top may be forming.
While this type of strategy will never perfectly pinpoint turning points in parabolic markets, it can help keep traders on the right side of the trend more often than not and limit the risk of catastrophic loss regardless of when these breathtaking bull markets come to an end.
Latest market news
Today 08:28 AM
Yesterday 03:30 PM
Yesterday 01:23 PM
Yesterday 11:00 AM
Yesterday 08:15 AM
Latest Tech Stocks articles
October 19, 2023 09:47 AM
October 18, 2023 12:06 PM
October 11, 2023 02:41 PM
October 3, 2023 12:24 PM