


December 2, 2019 11:30 AM
December Brings the Volatility!
Welcome to December! As my colleague Ken Odeluga wrote in our Market Brief, the day had started off pretty well with both the official Chinese PMI (released Saturday) and China’s unofficial measure of manufacturing, the Caixin PMI, both beat expectations. With that, stock indices, the Australian Dollar, and the New Zealand Dollar were all trading higher on the day. Then early in the US session, Trump tweeted that tariffs would be restored on steel and aluminum shipped from Brazil and Argentina to the US. Stocks and the US Dollar both began to sell off. However, the selling did not start in earnest until the US ISM Manufacturing PMI for November was released at 48.1 vs 49.2 expected and 48.3 last. A reading above 50 indicates economic expansion and a reading under 50 indicates economic contraction. November is now the fourth straight month of a reading under 50, and therefore, economic contraction.
The US Dollar Index has had a difficult time trading about the 50% retracement level from the highs on October 1st to the lows on November 1st. The DXY has been trading near the 98.40 level for a week and could not get a significant move above it. With today’s price action, price moved aggressively lower and is now trading back at support between the 97.85/98.00 area. If price breaks lower through this level, 97.65 may be the next level of support.
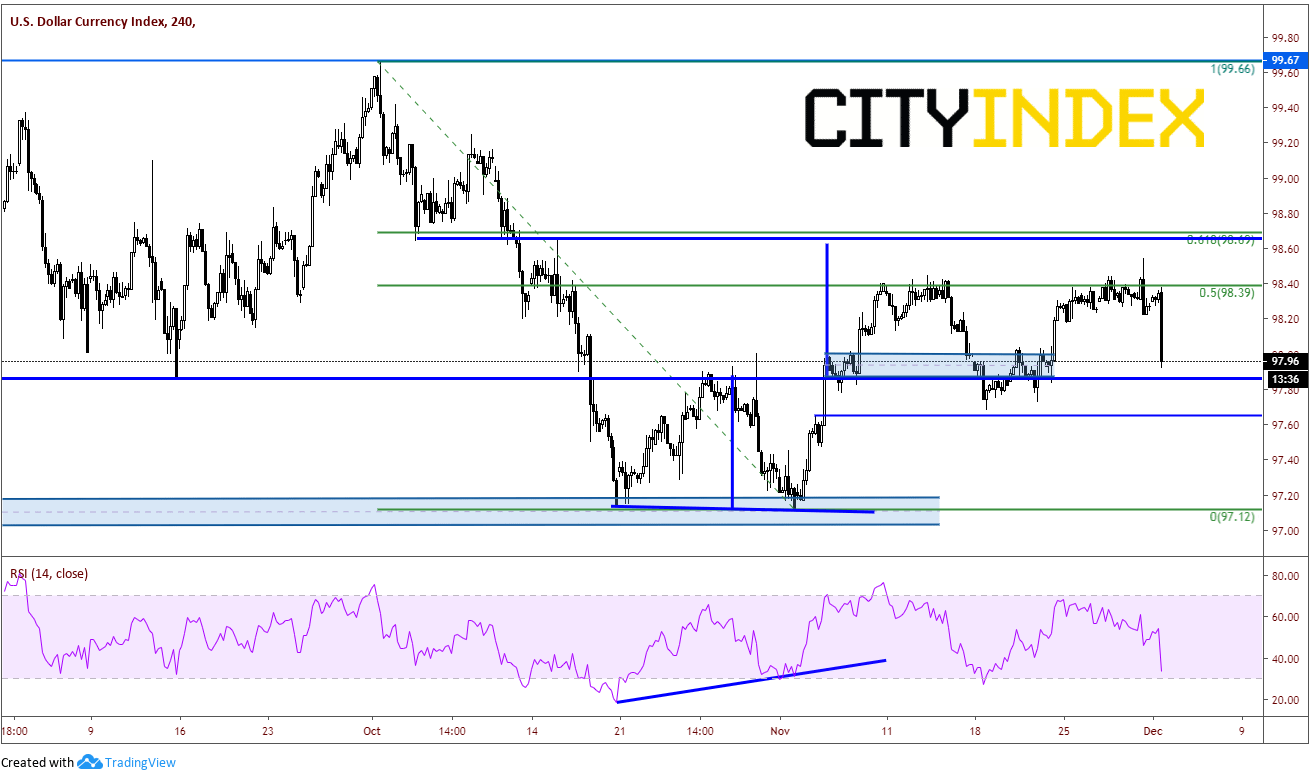
Source: Tradingview, City Index
In addition, the S&P 500 Index is down 30 handles as the markets got smashed by the tweets and ISM data. After putting in new all-time highs last week, the index has pulled back and is currently trading near horizonal and trendline support at 3110/3113.
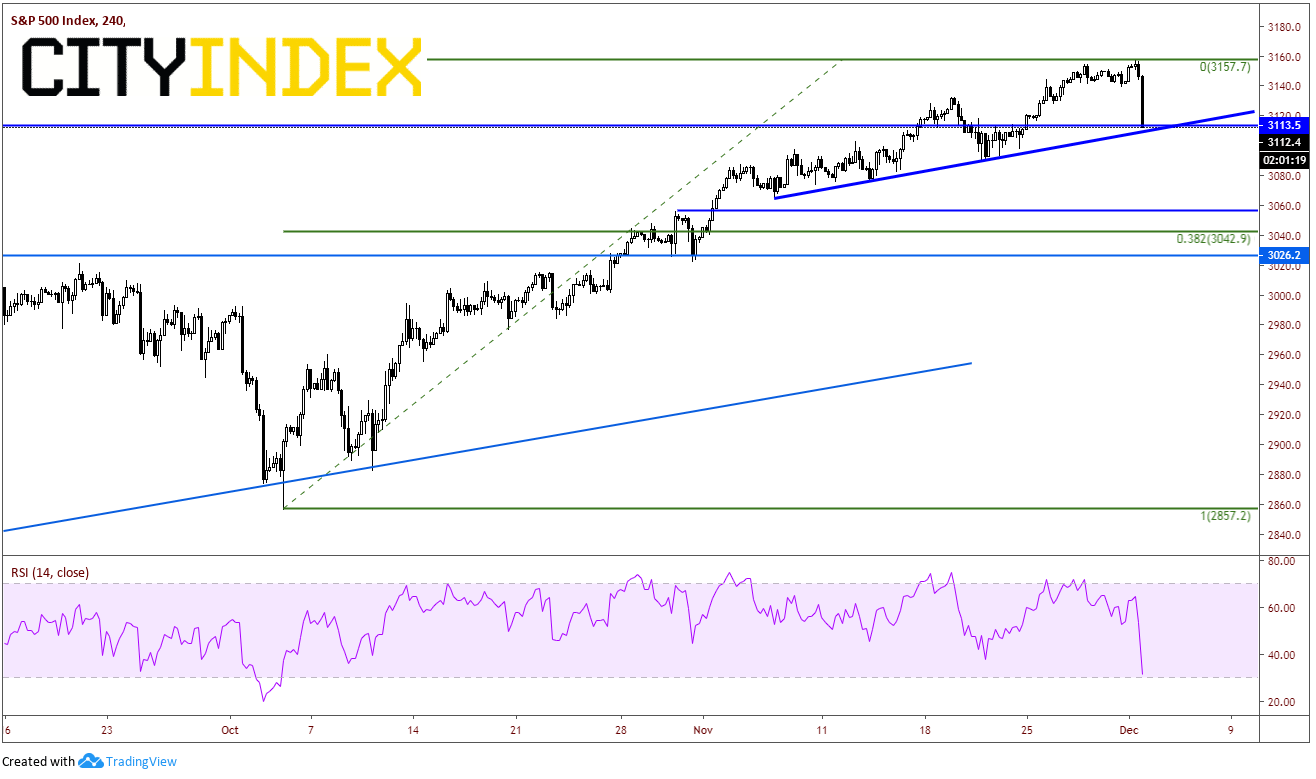
Source: Tradingview, City Index
If price breaks below 3110, there is a longer upward sloping trendline dating back to September 2018 which comes across near 3075. Also, if the S&P 500 closes below 3137, a bearish engulfing candle will form and the daily chart.
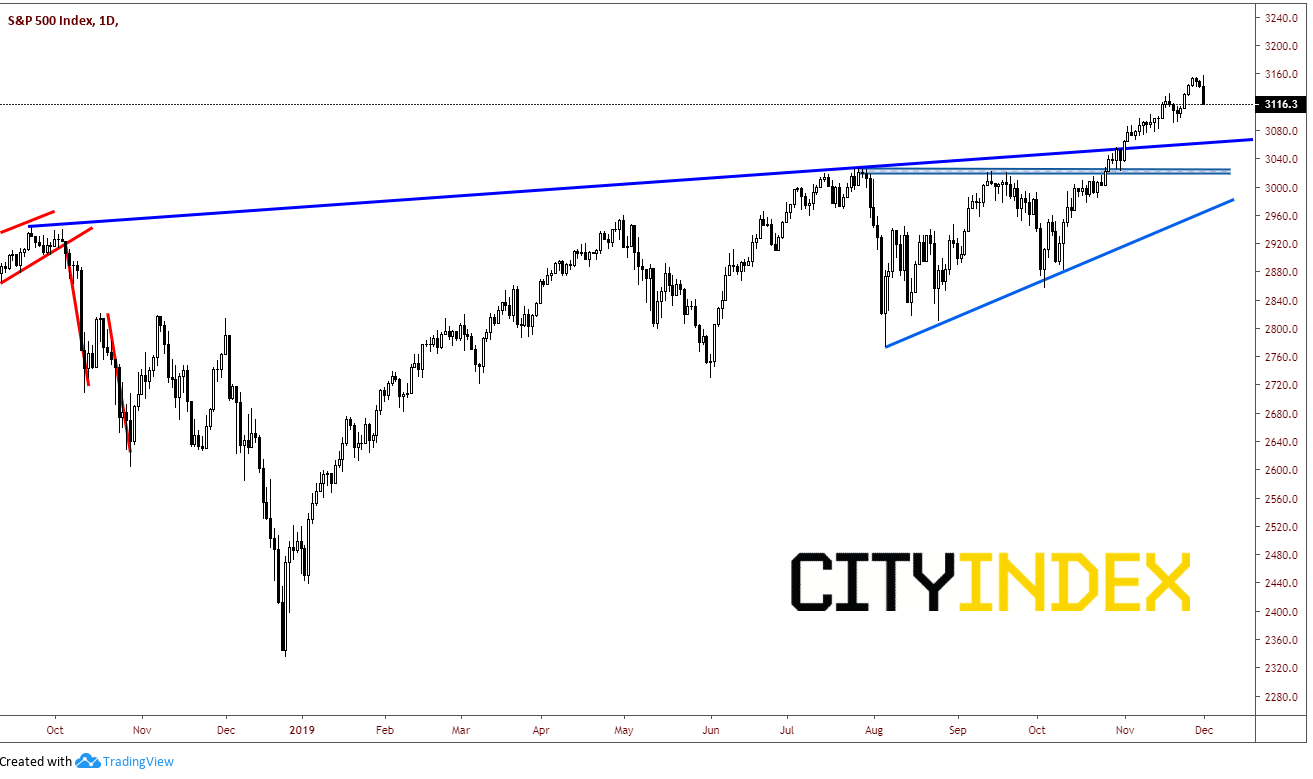
Source: Tradingview, City Index
Along with the risk off theme of the US session, it’s no surprise that USD/JPY is trading lower. The pair broke through the neckline of the inverse head and shoulders last week, only to see it collapse today and trade back under it. USD/JPY is currently 70 pips off its highs of the day. As with the S&P 500, if the pair closes below 109.40 today, there will be a bearish outside candle, an indication prices may trade lower in the days to come.
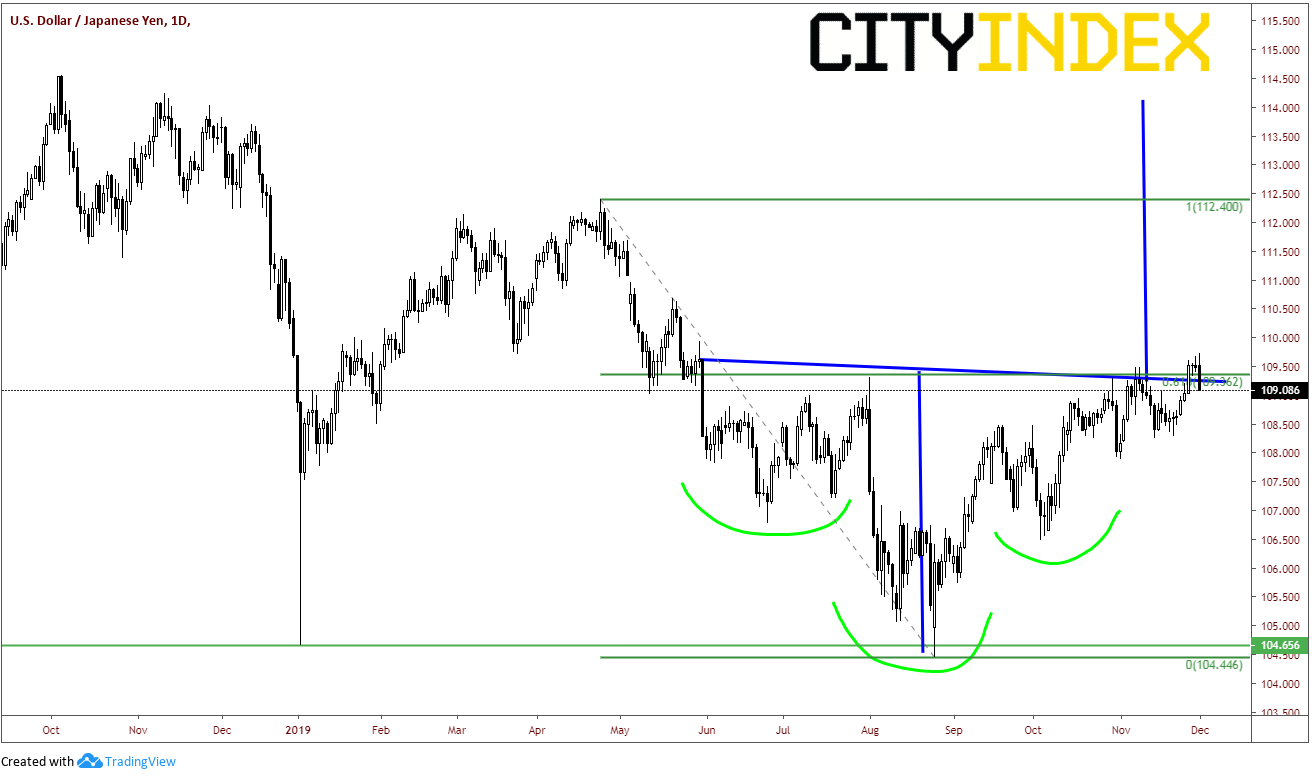
Source: Tradingview, City Index
Watch for more tweets from President Trump throughout the day and the week. He does not seem like a President who tolerates a falling stock market. Perhaps a China-US trade deal is almost done, again? And don’t forget NFP on Friday!
December has just begun!!
Latest market news
Today 04:00 PM
Today 01:15 PM
Today 11:30 AM
Today 08:18 AM
Latest Dollar articles
April 18, 2024 06:20 AM
February 16, 2024 11:30 AM
February 7, 2024 03:30 PM
February 2, 2024 02:00 PM