DAX resumes bullish trend as Grexit risks subside
European stocks are higher once again today as investors continue to unwind their safe haven trades opened in the previous months as the crisis in […]
European stocks are higher once again today as investors continue to unwind their safe haven trades opened in the previous months as the crisis in […]
European stocks are higher once again today as investors continue to unwind their safe haven trades opened in the previous months as the crisis in Greece unfolded. Late last night Greece’s lawmakers approved new austerity measures that are a precondition of up to €86 billion in bailout. The vote is also expected to pass the other Eurozone parliaments which should see Greece receive the funds it so desperately needs soon and thus avoid being kicked out of the euro. The focus is now on the European Central Bank, with the policy statement due at 12:45 BST and the press conference at 13:30 BST. Given the increased fears over a total collapse of the Greek banking system, among other risks facing the Eurozone, we think it is highly unlikely that the ECB will give any hints about tapering its bond-buying programme at this meeting, let alone interest rate rises. Thus we expect this policy meeting to be a dovish one, which could see the euro collapse and stocks to surge higher.
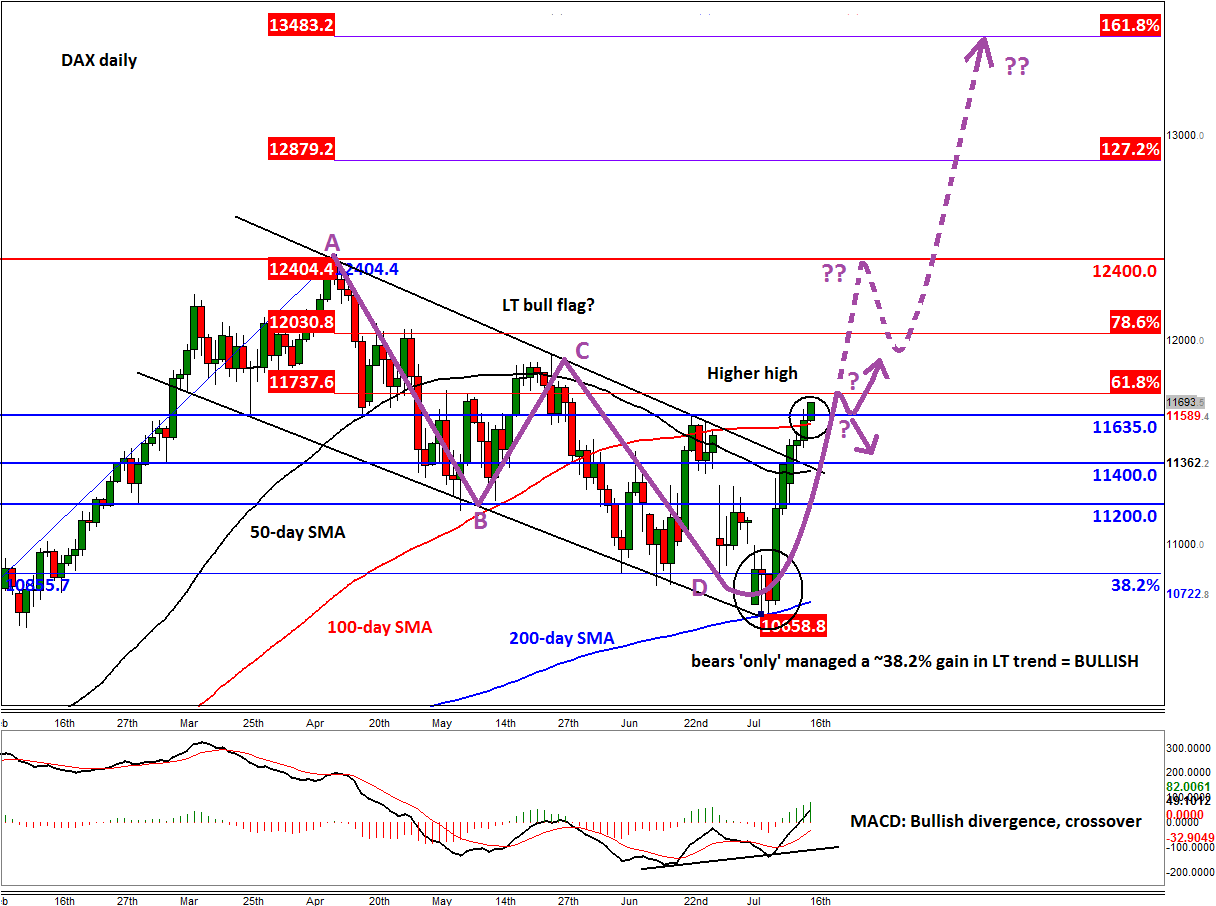
The technical outlook for the European stock markets appears rather constrictive following the recent recovery. Take the DAX as an example. The German benchmark has broken above the June high of 11635 today, thereby creating its first “higher high” following the recent pullback from the all-time high that it had achieved in April. In another bullish development, the index has already broken out of its bearish channel, which now looks like a long-term bull flag breakout. That’s because, Elliot Wave theorists think that we are now in the fifth wave of the long-term trend that started in 2009. Thus, we are potentially closer to the top, but probably not before we see a parabolic-like rally first. Also, the most recent pullback stalled around the relatively shallow 38.2% Fibonacci level of the upswing from October, where it also met the 200-day average. This in itself was a very bullish outcome.
In the very short-term outlook, traders will need to keep an eye on the 61.8% Fibonacci retracement level of the downswing from April, around 11735/40. If the index finds some resistance here then we may see a retracement to the previous resistance at 11635, which could turn into support. But if the 11635 level breaks down then a more significant pullback may be the outcome which could see the index revisit the old resistance-turned-support levels at 11400 or even 11200.
However, if the abovementioned 61.8% Fibonacci level gets broken (especially if with relative ease) then we could see further follow-up technical buying for the foreseeable future. Indeed, there is not much further resistance seen until the previous record high around 12400/5. If we get there, there is obviously a possibility for a double top reversal pattern. But a decisive break of that level could see the index rally towards the 161.8% Fibonacci extension/exhaustions level at 13480/5 where a significant top may be formed. This area is obviously miles away from where we stand at the moment, but we wouldn’t be surprised if we got there by the end of this year.