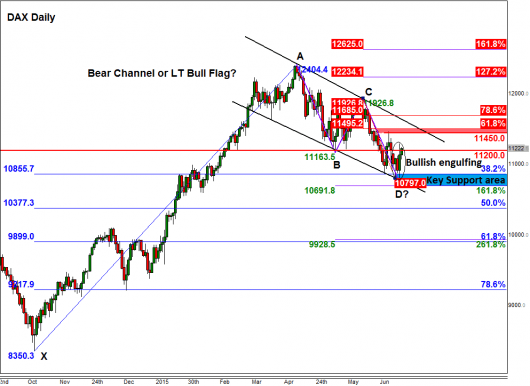
DAX creates potential reversal
European stocks are trading higher today following a sharp rally on Thursday. Sentiment has improved on the back of strong US macroeconomic data and a […]
European stocks are trading higher today following a sharp rally on Thursday. Sentiment has improved on the back of strong US macroeconomic data and a […]
European stocks are trading higher today following a sharp rally on Thursday. Sentiment has improved on the back of strong US macroeconomic data and a slightly dovish Fed. Together these factors have inspired a rally on Wall Street, which saw fresh all-time highs for the Nasdaq Composite and Russell 2000 indices overnight. The dollar has bounced back after dropping sharply on Wednesday, causing the EUR/USD to fall back to the 1.13 handle. The relatively weaker euro is boosting the appeal of European exporters, and is thus another reason why the markets have bounced back. In Europe, the major indices are showing gains of between 0.5 and 1.0 per cent. Greece remains a near term concern, but some of the bad news has now been priced in. Yesterday, there were rumours that the EU and ECB would extend the deadline for funding until the end of the year. This will have allowed Athens to avoid a default at the end of this month. But the Euro group meeting ended with no such an agreement. So it remains to be seen whether a deal for Greece may finally be sealed before Greece runs out of cash at the end of the month.
As well as the weaker euro and positive vibes coming out of Wall Street, European stocks are boosted by short-side profit-taking. Take the DAX as an example. Yesterday, we highlighted the importance of a key area of support between 10690 and 10855. The upper end of this range corresponds with the 38.2% Fibonacci retracement of the upswing from October. This represents a very healthy and shallow pull back inside a long-term bull trend. Shrewd speculators are aware that strong bull trends typically only manage a retracement of this magnitude before pushing further higher. But even if the DAX goes on to take out the 38.2% Fibonacci level, the lower end of the abovementioned support range at 10690 my hold as support. That is because this level corresponds with the 161.8% extension of the last notable and short-lived upswing we saw in May (i.e. of the BC swing), which is a potential exhaustion point for the bears. In addition, 10690 also represents the point D of an AB=CD pattern and thus a Bullish Bat/Gartley pattern, too. Making it even more intriguing is the fact that the point D comes in right at the support trend of the bearish channel, though this will partly depend on the speed of the index’s potential drop to this level.
But that is if the DAX gets there in the first place, because as mentioned, the index has already bounced back from the upper end of the support range so it could head much higher from here. Indeed, the index has created a large bullish outside candlestick formation following yesterday’s upsurge. This suggests that there was a strong shift from selling to buying activity. At the time of this writing, the index was back above the pivotal 11200 mark and remained on course to head towards the next potential resistance at 11450. Thereafter is the 61.8% Fibonacci retracement of the downswing from May, at 11495, then the resistance trend of the bearish channel around 11600-30 (depending on how fast the index will get there, if it does). If and when the index breaks out of the bearish channel then the resumption of the long-term bullish trend would be confirmed.