


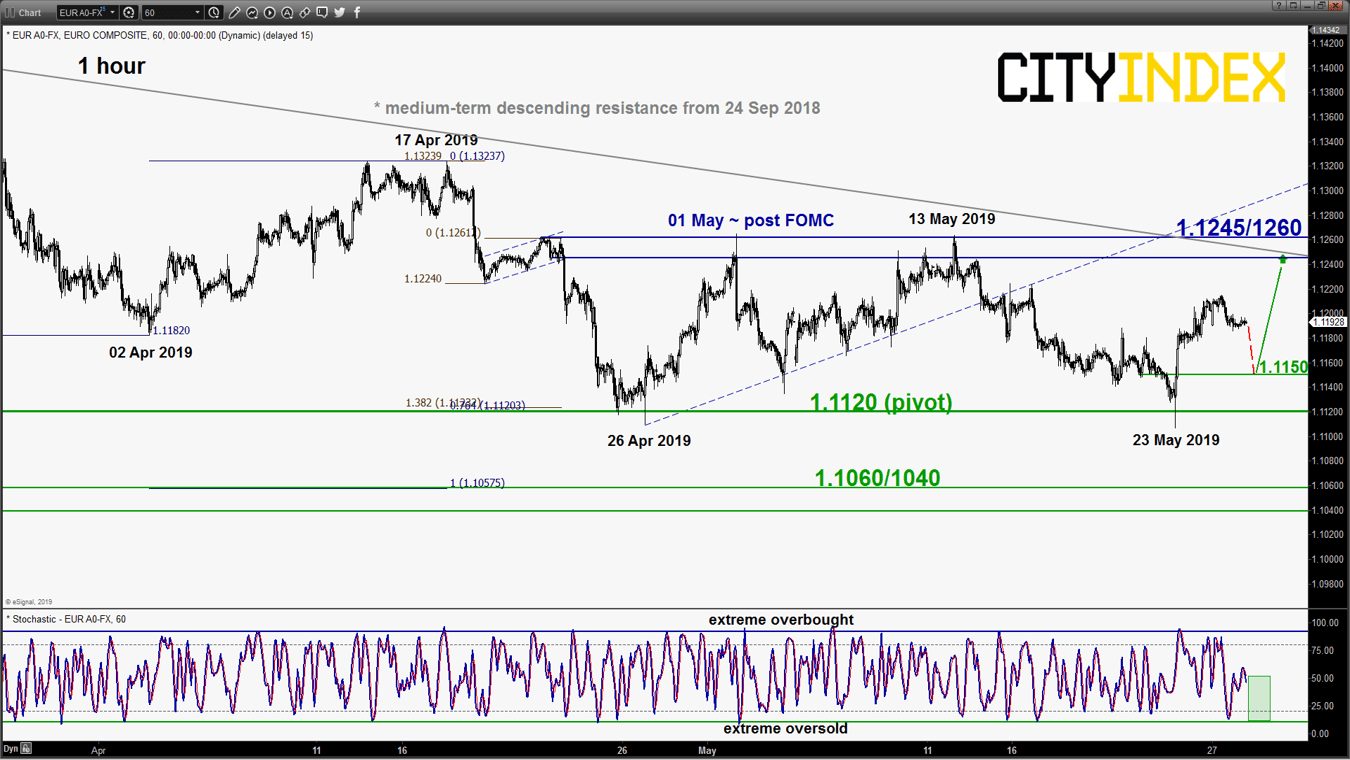
EUR/USD – Push up within range
click to enlarge chart
- The pair has started to trade within a minor sideways range after a test on the 1.1120 level on 23 May 2019. Key short-term pivotal support will be at 1.1120 for any potential dips (hourly Stochastic oscillator has inched downwards and still has room for further downside before it reaches an extreme oversold leve1) for another potential push up to target the minor range resistance at 1.1245/1260 (recent post FOMC swing high areas & medium-term descending resistance from 24 Sep 2018).
- However, an hourly close below 1.1120 resumes the bearish impulsive downleg sequence towards the next near-term support at 1.1060/1040 (Fibonacci retracement/expansion cluster).
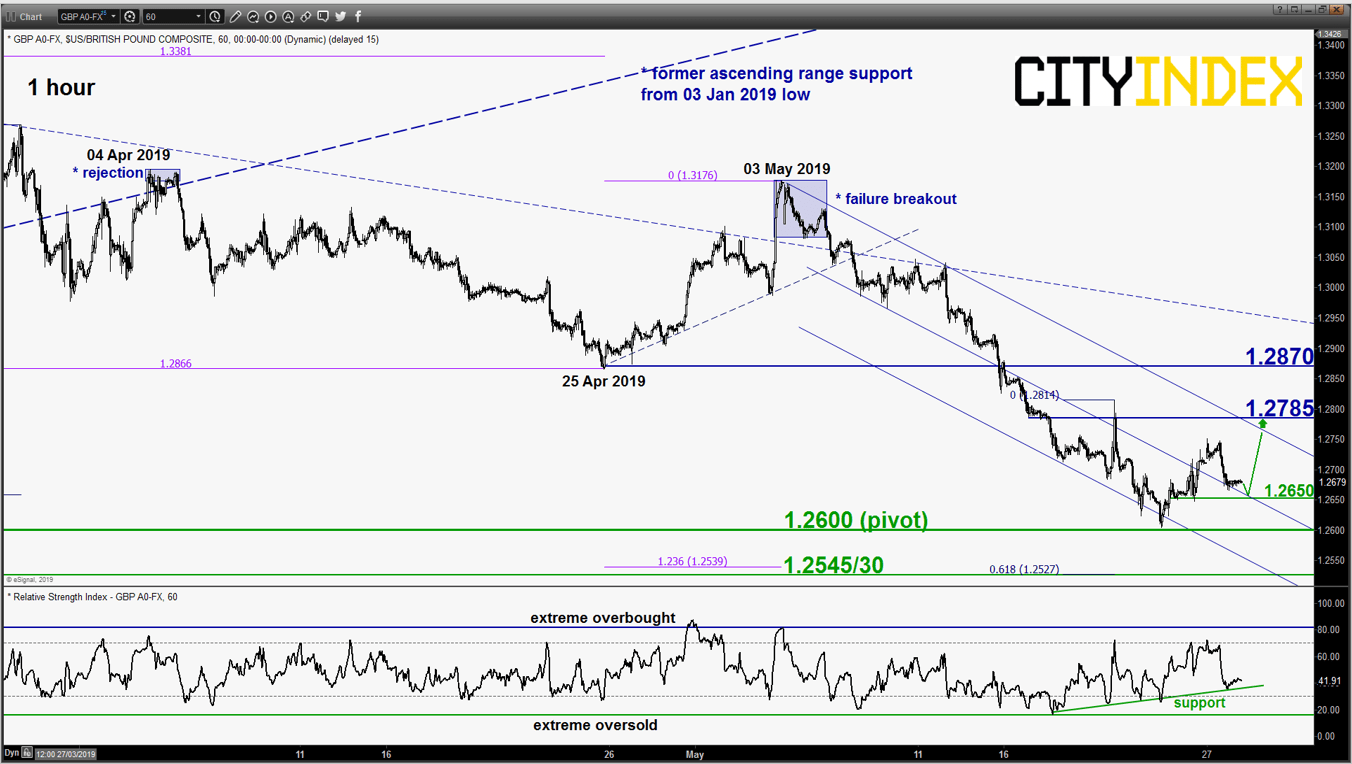
GBP/USD – 2nd leg of potential corrective rebound
click to enlarge chart
- In our previous report (click here for a recap), we had highlighted the risk of a corrective rebound scenario above 1.2600. Indeed, the pair had staged the expected bounce and hit the first target/resistance of 1.2720 (printed a high of 12733 on last Fri, 24 May U.S. session).
- Maintain bullish bias with 1.2600 remains as the key short-term pivotal support for another potential corrective bounce towards the next intermediate resistance at 1.2785 (also the upper boundary of the minor descending channel in place since 03 May 2019).
- However, an hourly close below 1.2600 resumes the slide towards the major support at 1.2545/2530 (also the primary ascending range support in place since 07 Oct 2016 low).
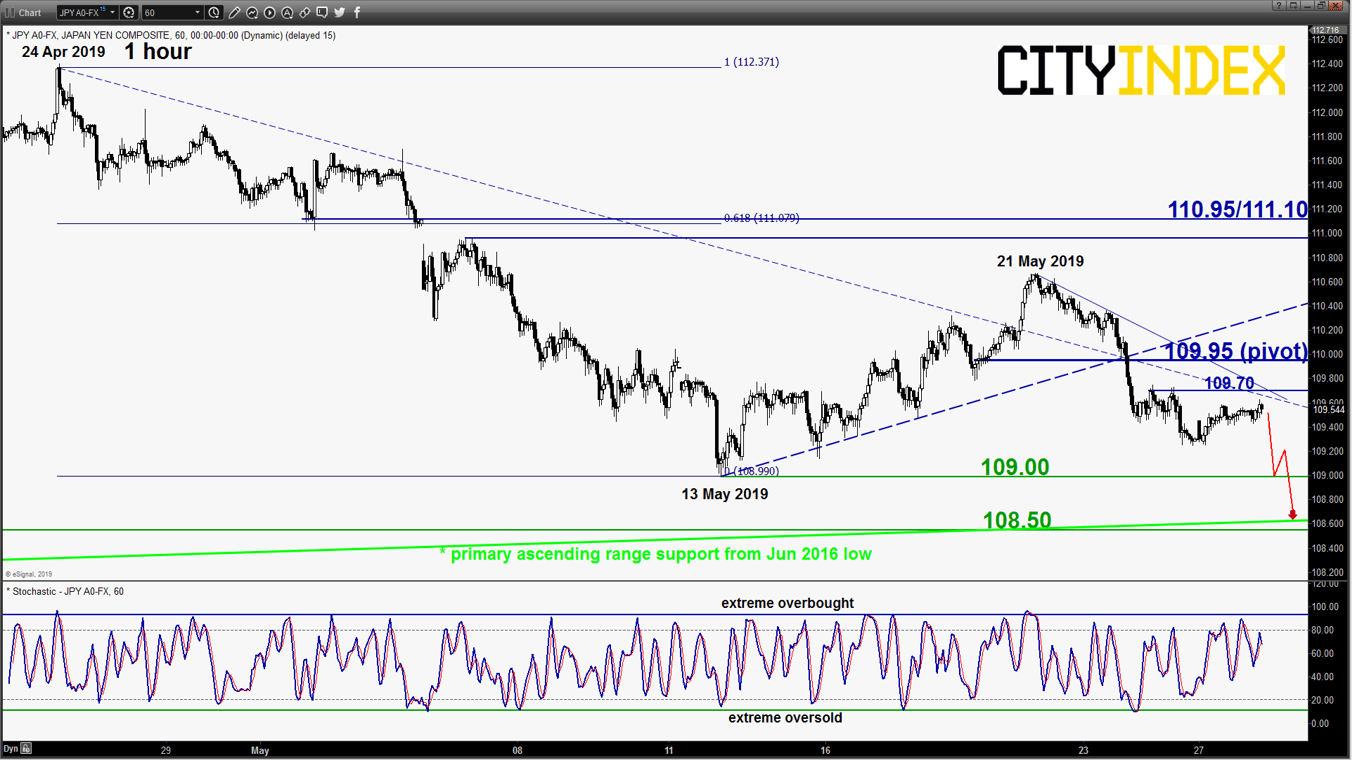
USD/JPY – Further downside
click to enlarge chart
- Drifted down lower as expected and printed a 3-day low of 109.27 on last Fri, 24 May. Maintain bearish bias below a tightened key short-term pivotal resistance now at 109.95 (50% Fibonacci retracement of the recent slide from 21 May high to 24 May low) for a further potential push down to retest 109.00 before targeting the major support at 108.50.
- However, a clearance with an hourly close above 109.95 invalidates the bearish scenario for a squeeze up towards 110.95/111.10 resistance (the gapped down formed on 06 May 2019 & a Fibonacci retracement/expansion cluster).
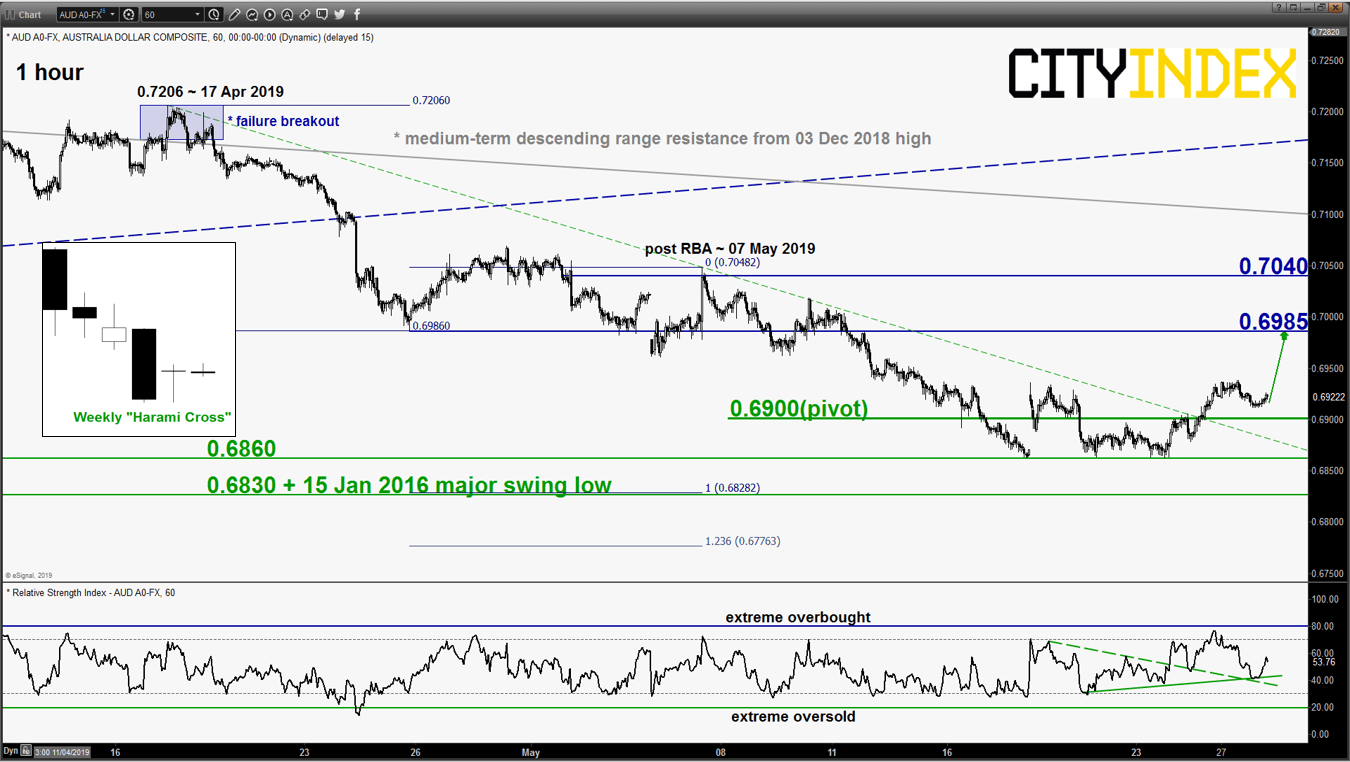
AUD/USD – Corrective bounce above 0.6900
click to enlarge chart
- Broke above the 0.6910 short-term pivotal resistance on last Fri, 24 May U.S. session that invalidated the bearish scenario. In addition, it ended last week with a weekly bullish “Harami Cross” and broke above the descending trendline resistance in place since 17 Apr 2019 high.
- Flip to a bullish bias with 0.6900 as the key short-term pivotal support for a further potential corrective bounce towards the next intermediate resistance at 0.6985.
- However, an hourly close below 0.6900 resumes the slide for a retest on 0.6860 before targeting 0.6830 next.
Charts are from eSignal
Latest market news
Latest Forex articles

April 17, 2024 02:40 PM
April 17, 2024 04:47 AM