


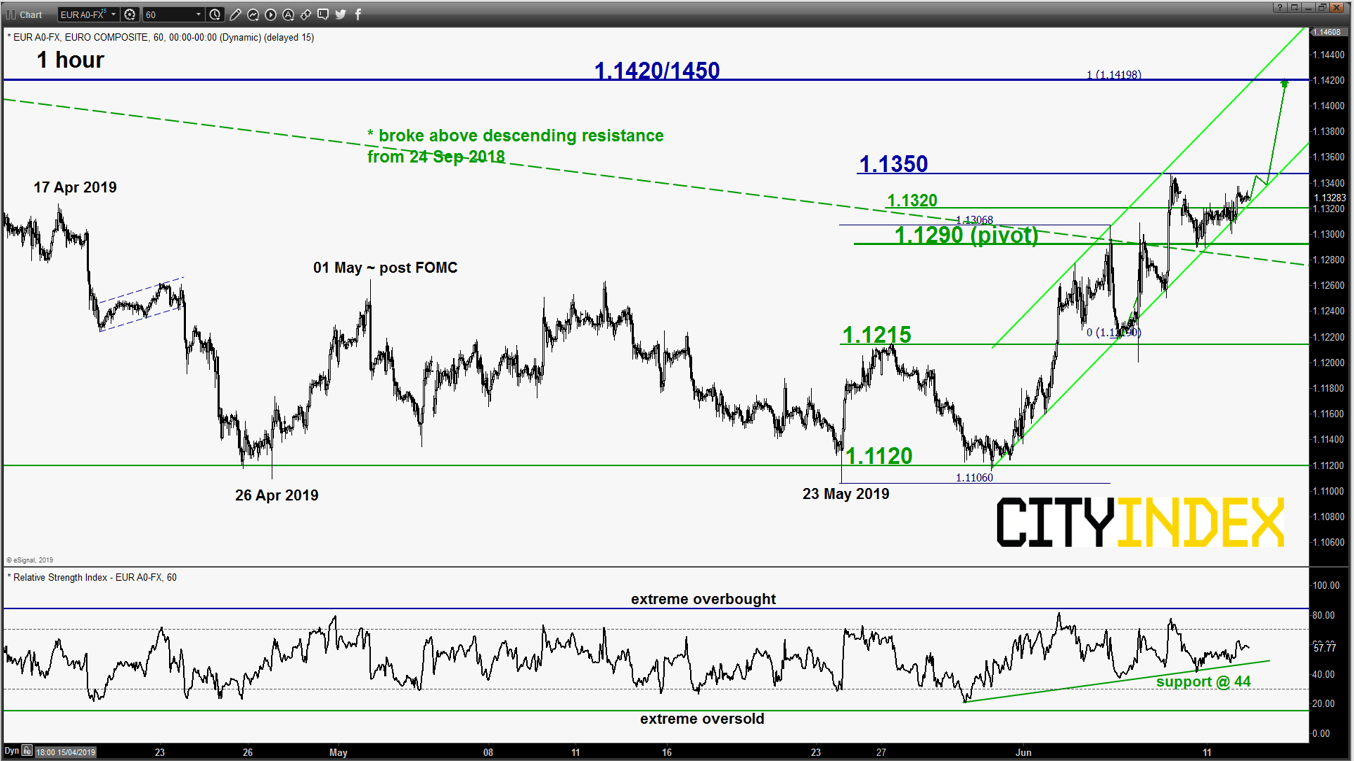
EUR/USD – Further potential push up remains in progress
click to enlarge chart
- Continued to inch higher as expected to print a marginal higher high of 1.1337 in yesterday, 11 Jun U.S. session. (click here for a recap on our previous report). No major changes on its key elements, maintain bullish bias with 1.1290 remains as the key short-term pivotal support (also the pull-back of the former descending resistance from 24 Sep 2018 & the lower boundary of a minor ascending channel from 30 May 2019) for a further potential corrective push up to retest last Fri, 07 Jun swing high area of 1.1350 before targeting the the key medium-term resistance at 1.1420/1450 (also the major descending trendline in place since 15 Feb 2018 & the 20 Mar 2019 swing high area).
- On the other hand, a break with an hourly close below 1.1290 suggests a failure bullish breakout for a slide back towards the next near-term support at 1.1215 within a medium-term range configuration in place since 26 Apr 2019 low.
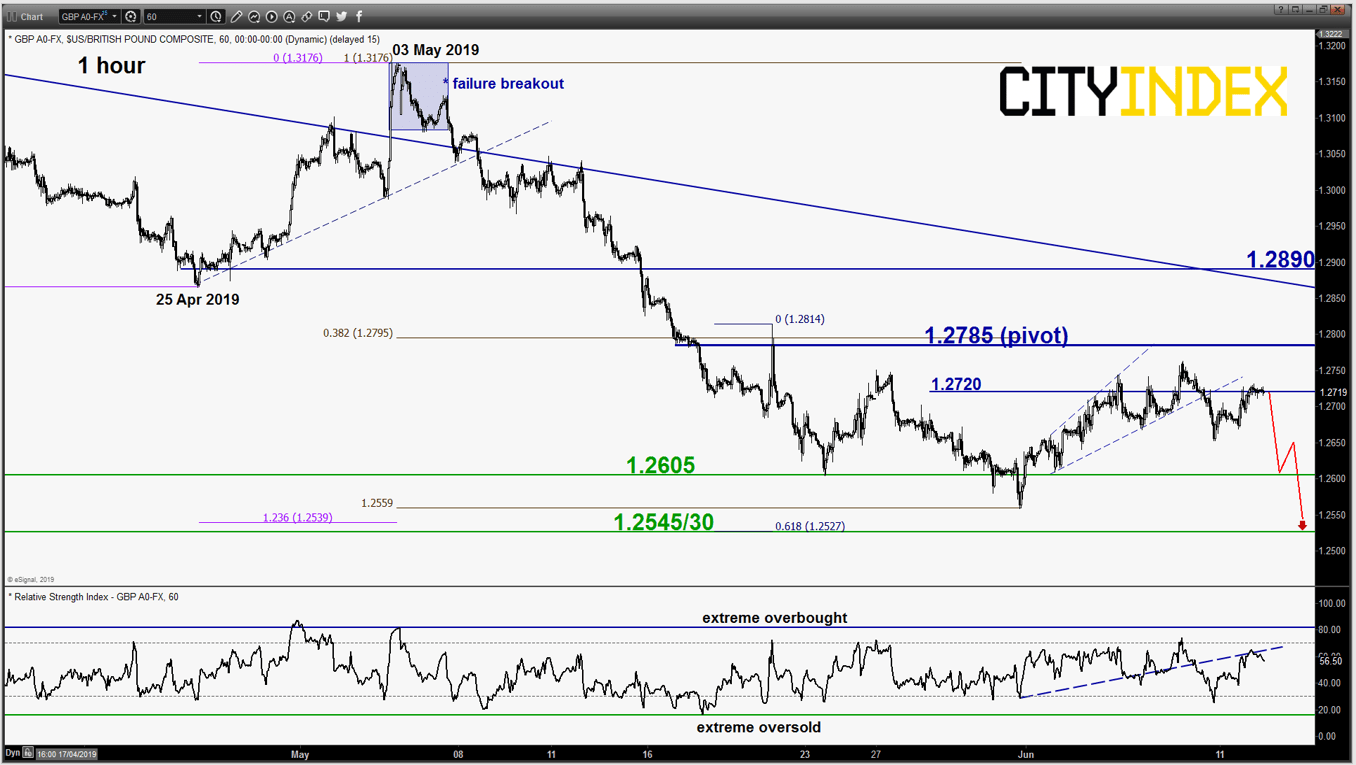
GBP/USD – 1.2785 remains the key resistance to watch
click to enlarge chart
- Inched higher but remained below the 1.2785 key short-term pivotal resistance. Maintain the bearish bias for a potential push down to retest 1.2605 and a break below it reinforces a further slide towards the major support of 1.2545/30 (also the primary ascending range support in place since 07 Oct 2016 low).
- On the other hand, an hourly close above 1.2785 invalidates the bearish scenario for an extension of the corrective rebound towards the 1.2890 key medium-term resistance (also the descending trendline from 13 Mar 2019).
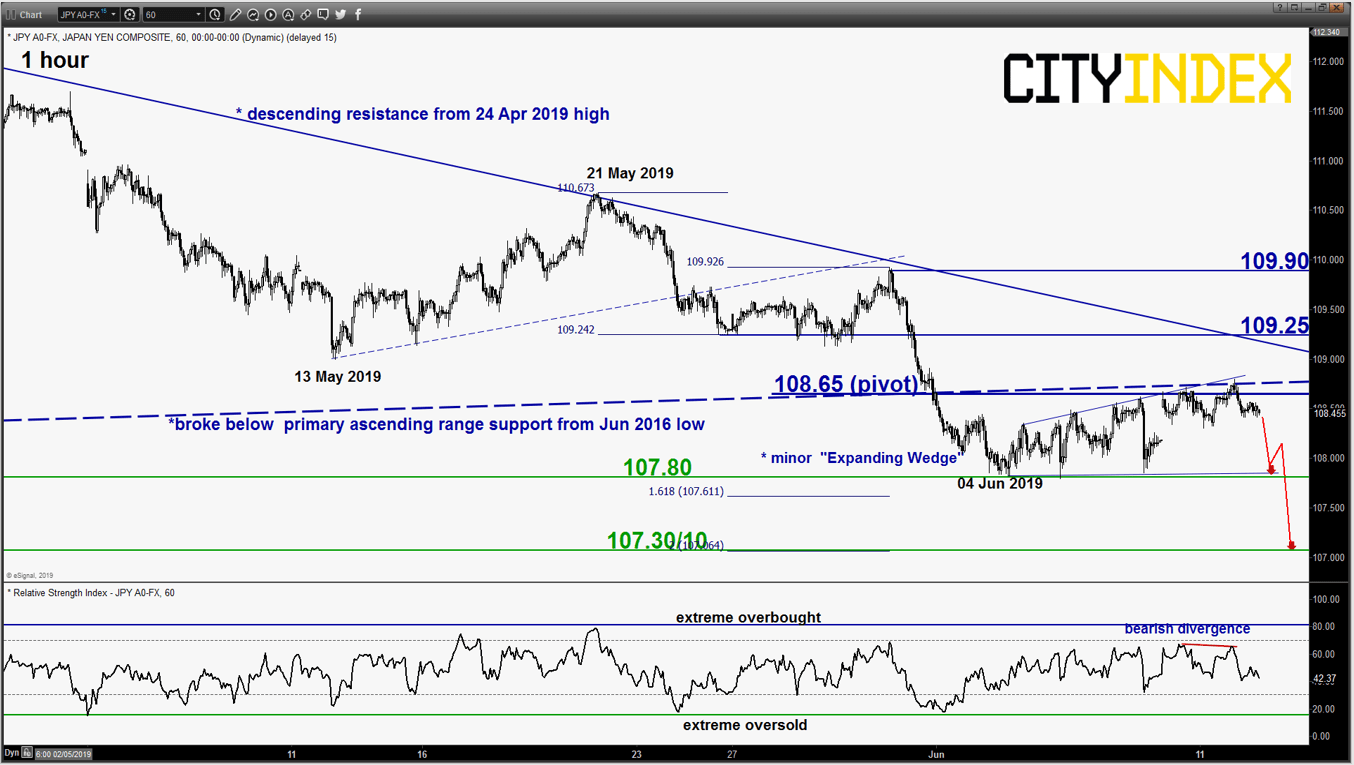
USD/JPY – Bulls rejected below 108.65 key resistance
click to enlarge chart
- Yesterday, the bullish force got rejected again right below the 108.65 key short-term pivotal resistance (also the upper limit of the minor “Expanding Wedge” as expected after a test on it in the European session (printed a high of 108.80).
- Interestingly, the hourly RSI oscillator has shaped a bearish divergence signal near its overbought region which suggests that short-term upside momentum has abated. Maintain bearish bias below 108.65 key short-term pivotal resistance for a potential drop to retest 107.80 and a break below it reinforces a further slide towards the next near-term support at 107.30/10 (Fibonacci expansion cluster).
- On the other hand, an hourly close above 108.65 invalidates the bearish scenario for a squeeze up to retest the next intermediate resistance at 109.25 (also the descending trendline resistance in place since 24 Apr 2019 high that has capped previous bounces).
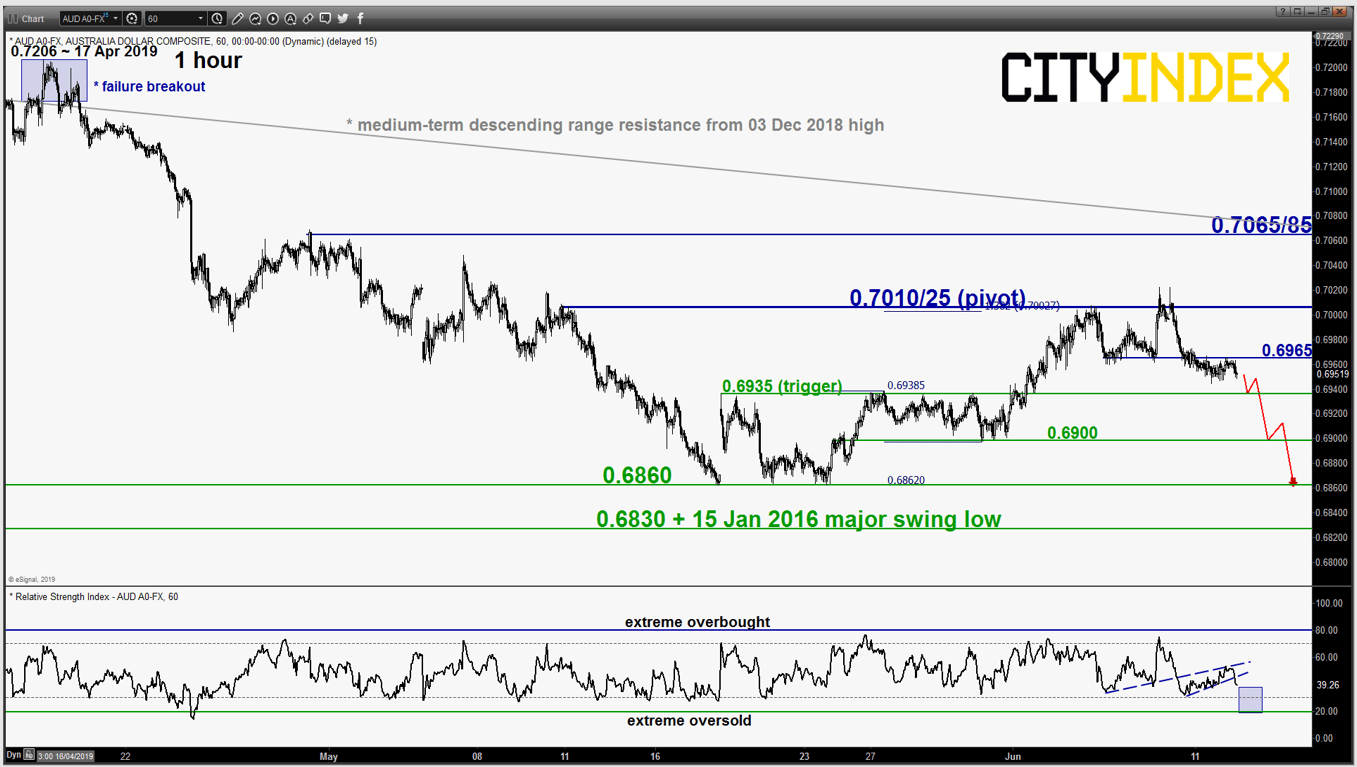
AUD/USD –Further potential push down below 0.7010/25 key resistance
click to enlarge chart
- No major changes on its key elements; maintain bearish bias below the 0.7010/7025 key short-term pivotal resistance for a further push down to test 0.6935 and a break below it sees a further potential slide towards the 0.6860 range support.
- On the other hand, an hourly close above 0.7025 negates the bearish tone for an extension of the corrective rebound towards the key medium-term resistance at 0.7065/85.
Charts are from eSignal
Latest market news
Today 11:14 AM
Today 08:28 AM
Yesterday 03:30 PM
Yesterday 01:23 PM
Latest EUR articles
April 13, 2024 08:00 PM
March 25, 2024 02:55 AM
January 22, 2024 04:19 AM
January 18, 2024 04:46 AM