


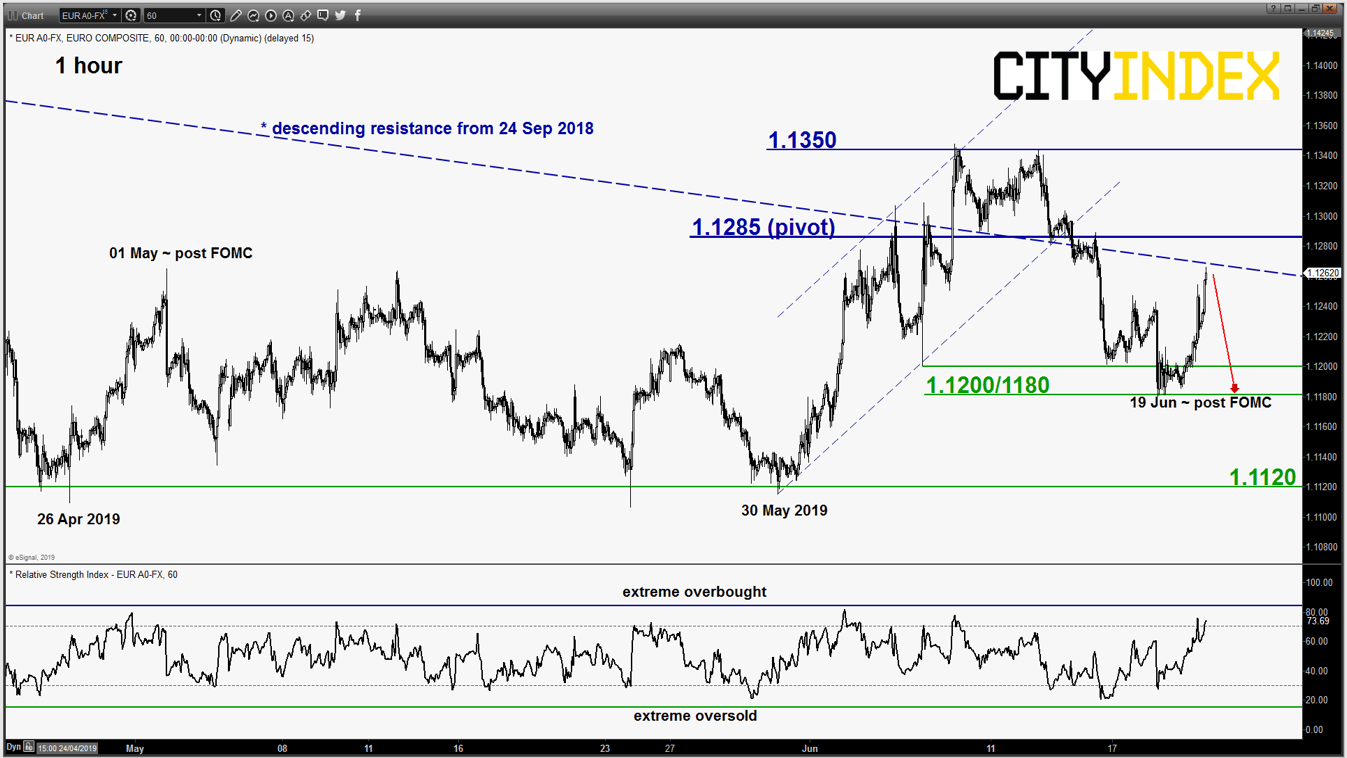
EUR/USD – Rallied up towards key resistance
click to enlarge chart
- Broke above 1.1220 that invalidated the preferred bearish scenario and squeezed up towards the alternate target/resistance of 1.1280. It has continued to inch higher in today’s Asian morning session as it printed a current intraday high of 1.1266 post FOMC where the Fed has signalled a rate cut in the Jul meeting.
- Yesterday’s push up has led the pair to hover just below the descending trendline from 24 Sep 2018 high now resistance at 1.1285 which also confluences with the 61.8% Fibonacci retracement of the recent slide from 07 Jun high to 18 Jun 2019 low. In addition, the push up has appeared to be “overstretched” as indicated by the hourly RSI oscillator now right below an extreme overbought level.
- Watch the key short-term pivotal resistance at 1.1285 for a potential slide back to retest the 1.1200/1180 near-term support. On the flipside, an hourly close above 1.1285 sees the continuation of the squeeze up towards 1.1350.
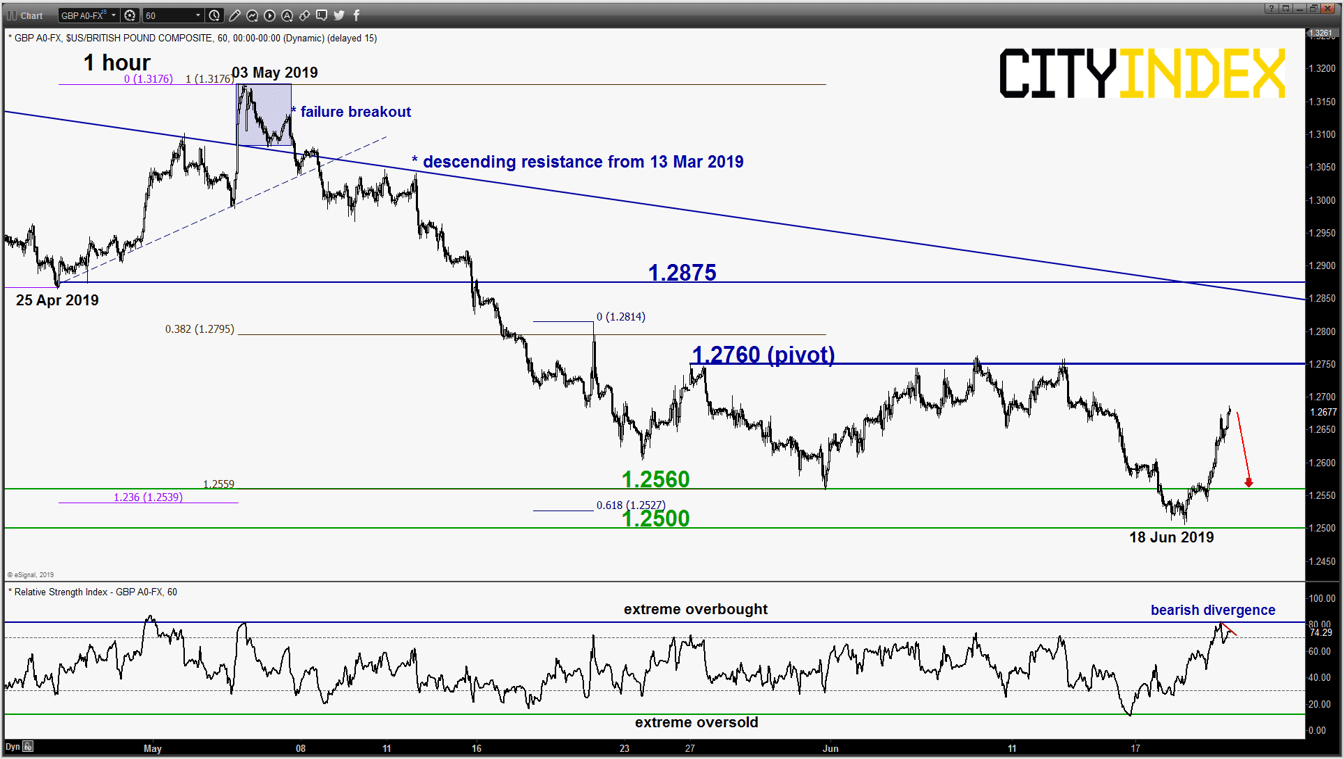
GBP/USD – Below key inflection level with bearish signal
click to enlarge chart
- Squeezed up as expected and hit the target/resistance of 1.2610/2650 post FOMC where it printed a current intraday high of 1.2687 in today’s Asian morning session (click here for a recap). Short-term momentum looks overstretched on the upside as the hourly RSI oscillator has flashed a bearish divergence signal at its extreme overbought level right below a key short-term inflection level of 1.2760 (also a Fibonacci retracement/expansion cluster).
- Flip to back to a bearish bias below 1.2760 key short-term pivotal resistance for a potential drop to retest 1.2560 with a maximum limit set at 1.2500 (the major ascending support from Oct 2016 low). On the flipside, an hourly close above 1.2760 invalidates the bearish scenario for a further squeeze up towards the next resistance at 1.2875.
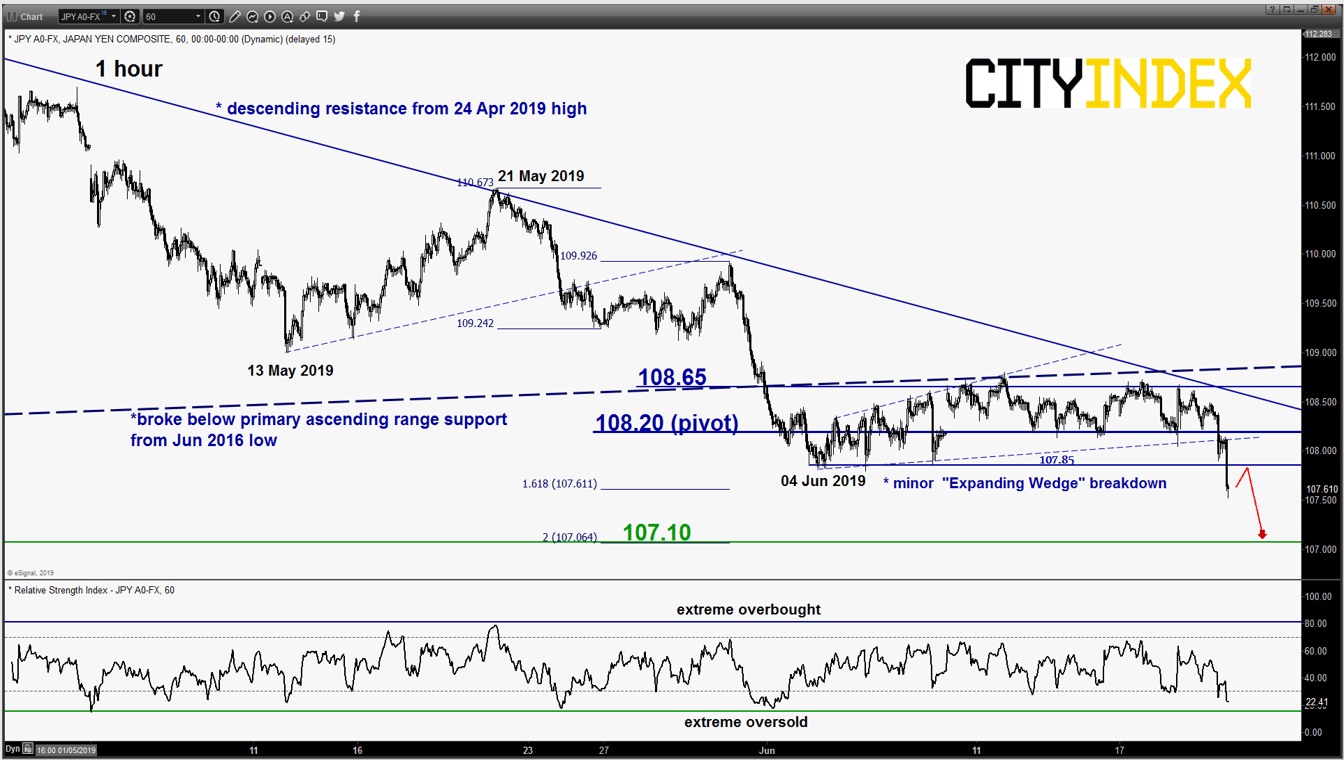
USD/JPY – Drop in progress
click to enlarge chart
- Staged the expected breakdown from the minor “Expanding Wedge” range configuration in motion since 04 Jun 2019. No clear signs of bearish exhaustion yet, maintain bearish bias with a tightened key short-term pivotal resistance now at 108.20 for a further potential drop towards the 107.10 support (Fibonacci expansion cluster).
- On the flipside, an hourly close above 108.20 negates the bearish tone for a push up to retest the 108.85 key medium-term resistance.
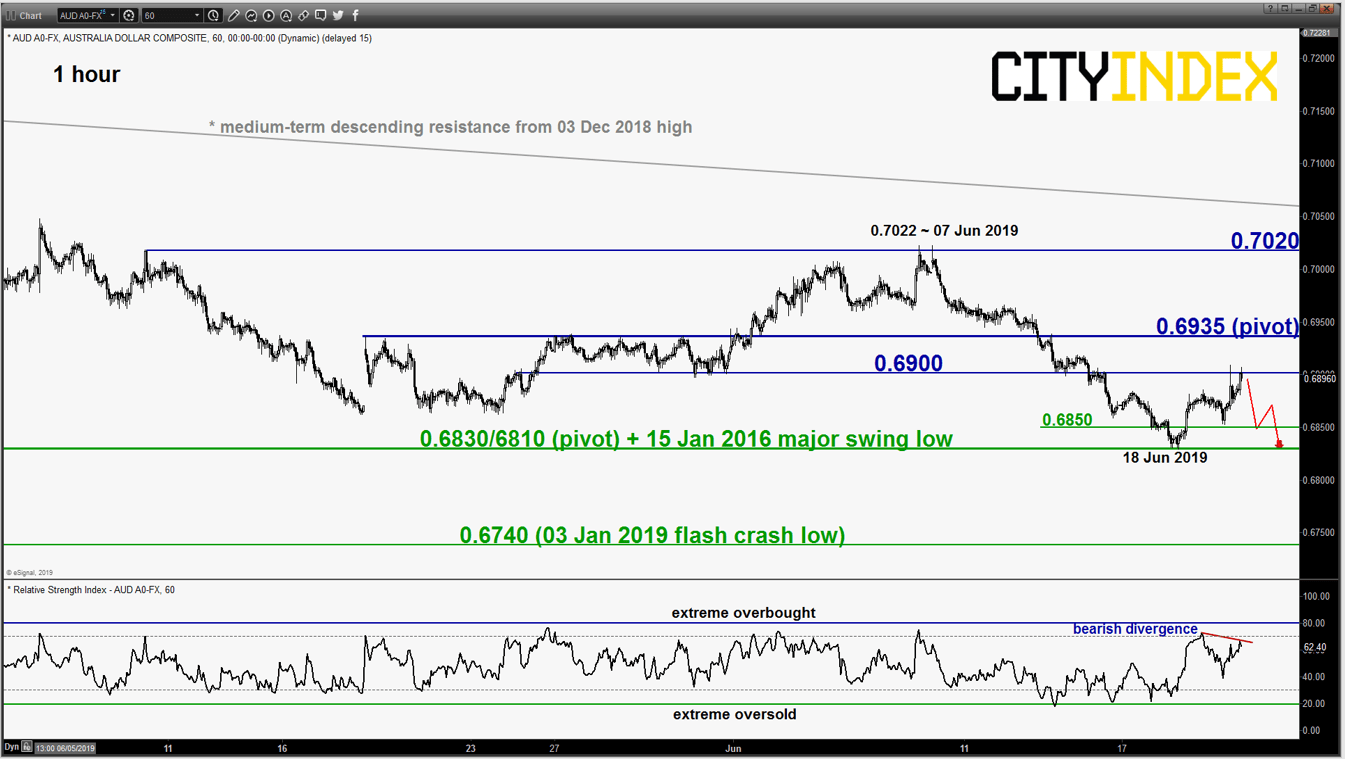
AUD/USD – Corrective rebound may have reached an exhaustion point
click to enlarge chart
- Pushed up as expected and hit the lower limit of the corrective rebound target at 0.6900 as per highlighted in our previous report. Right now, the hourly RSI oscillator has flashed a bearish divergence signal at its overbought region which indicates a slowdown in the recent upside momentum.
- Flip back to bearish bias below 0.6935 key short-term pivotal resistance for a potential push down to retest 0.6850 and the major support of 0.6830/6810. On the flipside, an hourly close above 0.6935 invalidates the bearish tone for a squeeze up towards the key medium-term resistance at 0.7020 (also the descending resistance from 03 Dec 2018 high).
Charts are from eSignal
Latest market news
Today 11:14 AM
Today 08:28 AM
Yesterday 03:30 PM
Latest USD articles
Yesterday 01:23 PM
April 23, 2024 11:09 PM
April 23, 2024 11:01 PM