


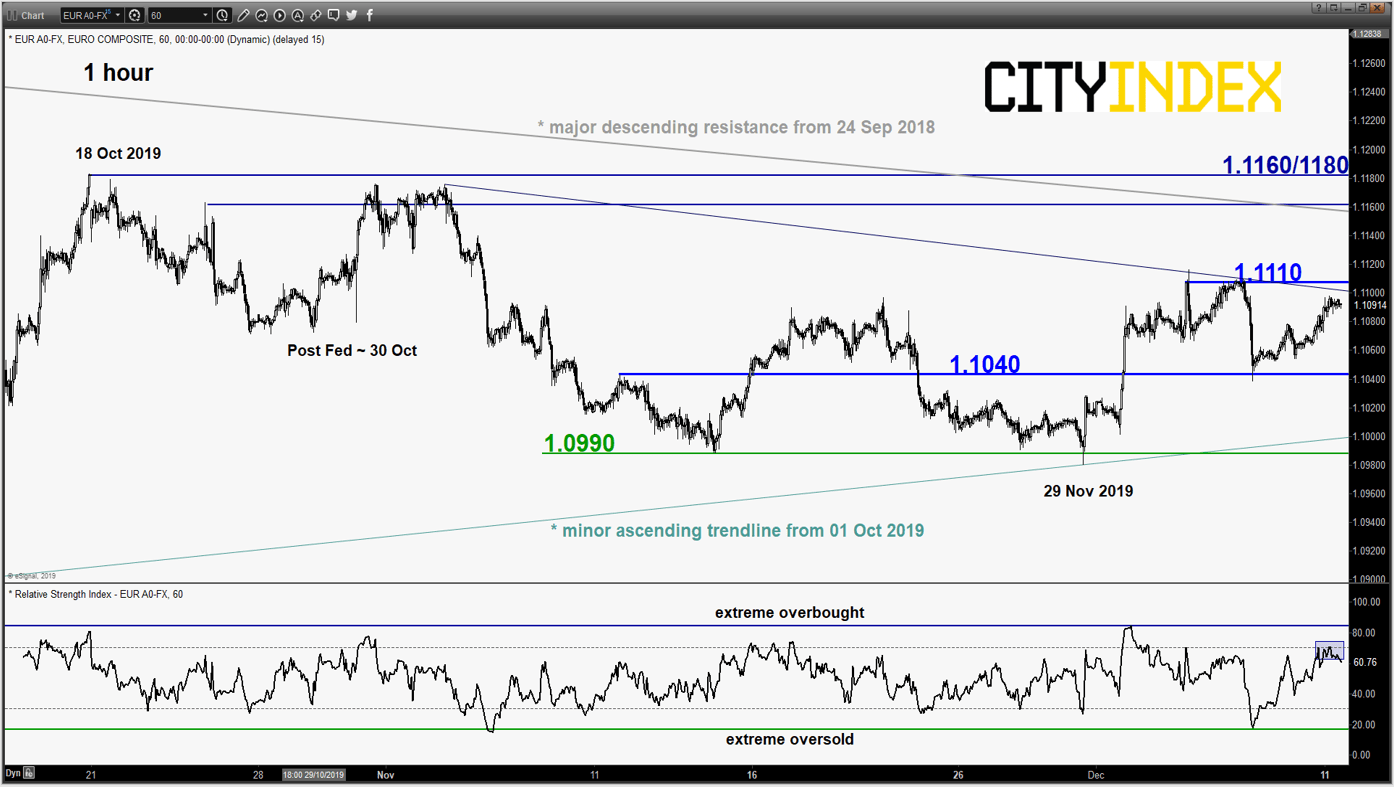
EUR/USD – Watch 1.1110 & 1.1040
click to enlarge chart
- Losses inflicted after last Fri’s 06 Dec better than expected U.S jobs data (NFP) has been reversed and the pair inched back up towards 1.1110.
- Mix elements; prefer to turn neutral first between 1.1110 and 1.1040. An hourly close above 1.1110 sees a squeeze up towards the 1.1160/1180 major descending resistance and the range top of 18 Oct/04 Nov 2019. Below 1.1040 sees a slide to retest 1.0990 minor range resistance and the ascending trendline from 01 Oct 2019 low.
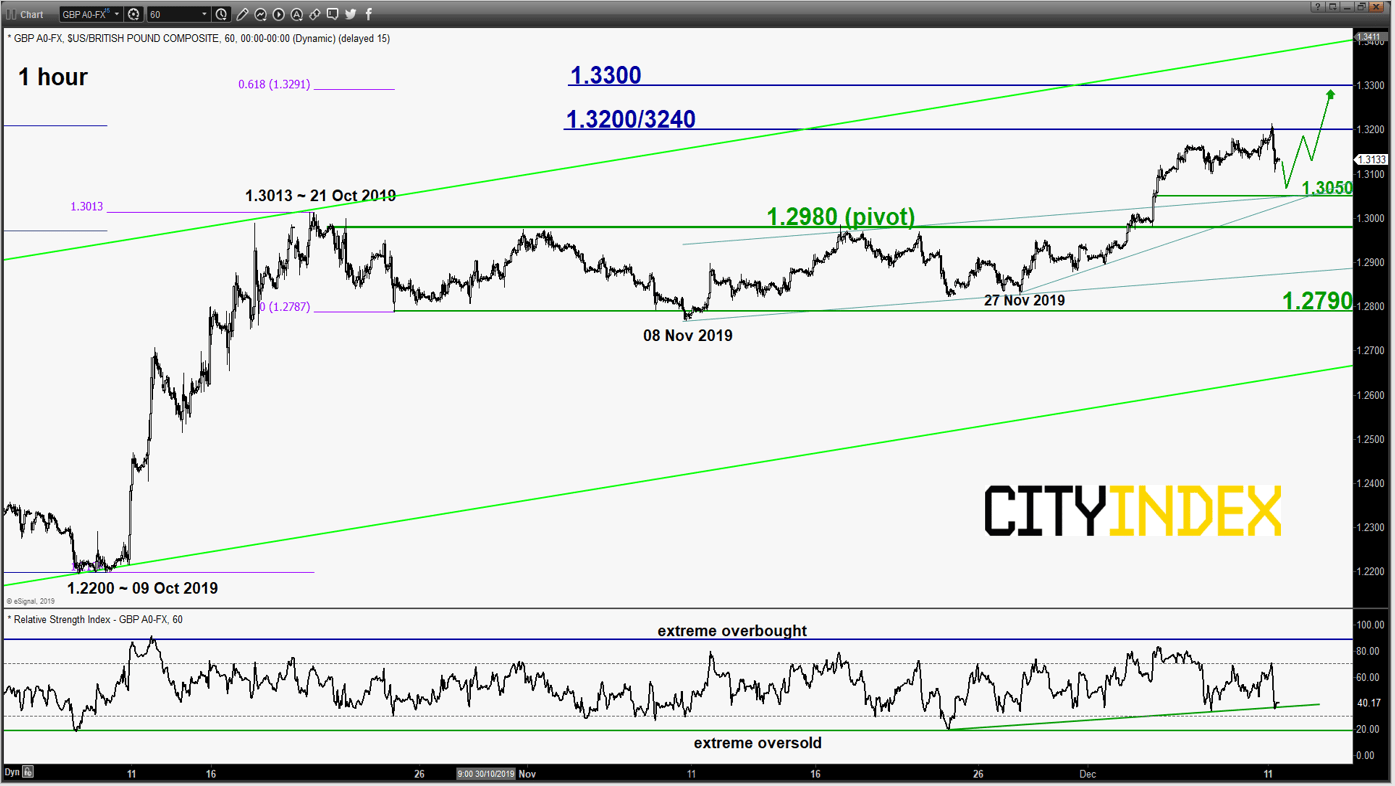
GBP/USD – No clear signs of bullish exhaustion yet
click to enlarge chart
- The pair has continued to inch higher and hit the 1.3200/3240 first resistance/target as per highlighted in our previous report (click here for a recap). Thereafter, it has staged a pull-back of 108 pips in yesterday’s 10 Dec U.S. session after a poll that indicated that PM Boris Johnson’s Conservatives majority has narrowed as we head into the UK General Election on 12 Dec.
- Overall, there is still no clear signs of a bullish exhaustion yet; maintain bullish bias in any dips above the 1.2980 key short-term pivotal support for a further potential push up to target the next resistance at 1.3300 (psychological & Fibonacci expansion cluster).
- On the other hand, a break with an hourly close below 1.2980 negates the bullish tone for a deeper pull-back towards the next support at 1.2790/2750.
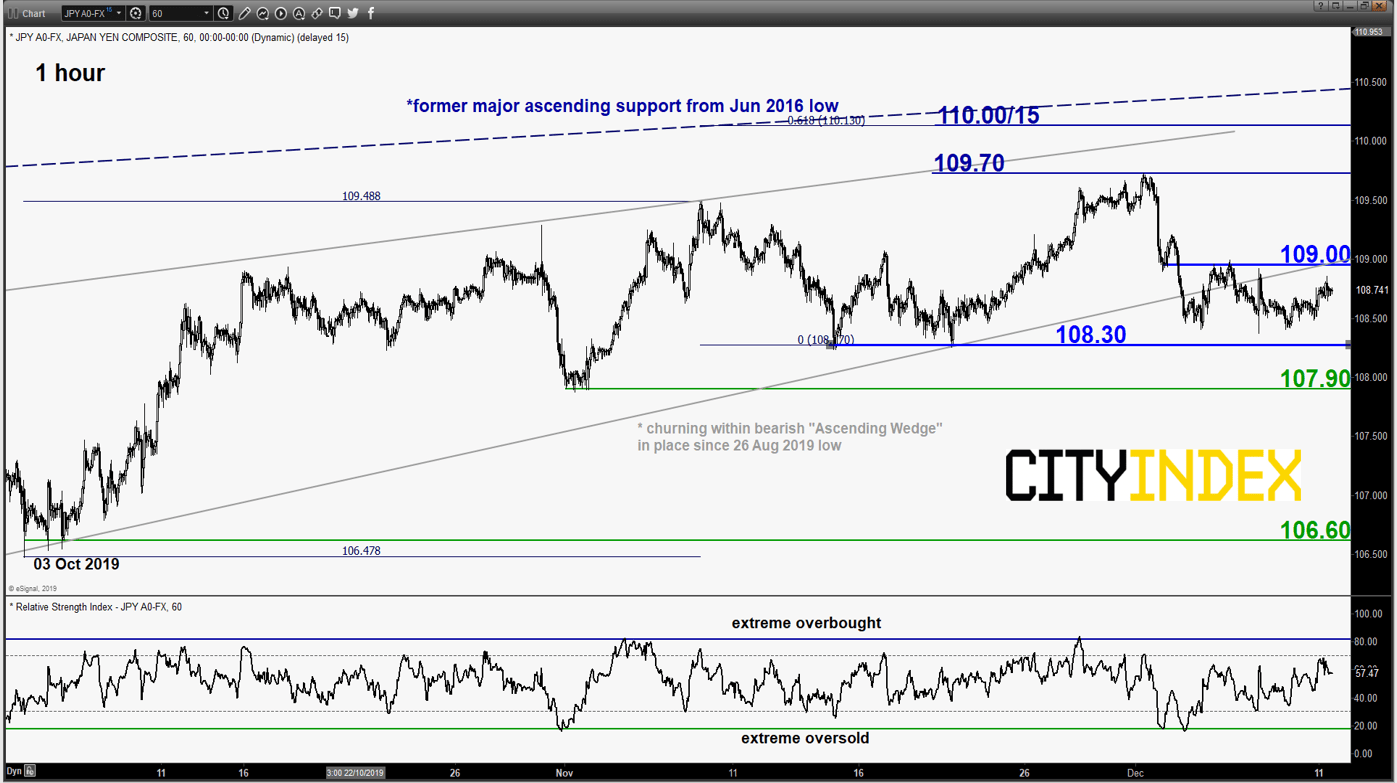
USD/JPY – Stuck within a minor range
click to enlarge chart
- No change, maintain neutrality stance between 109.00 and 108.30. Bears need to have an hourly close below 108.30 for a “clean break down” to target the next supports at 107.90 and 106.60 next.
- On the flipside, a clearance with an hourly close above 109.00 allows the short-term bulls to be in control for a push up towards 109.70 and 110.00/15 next.
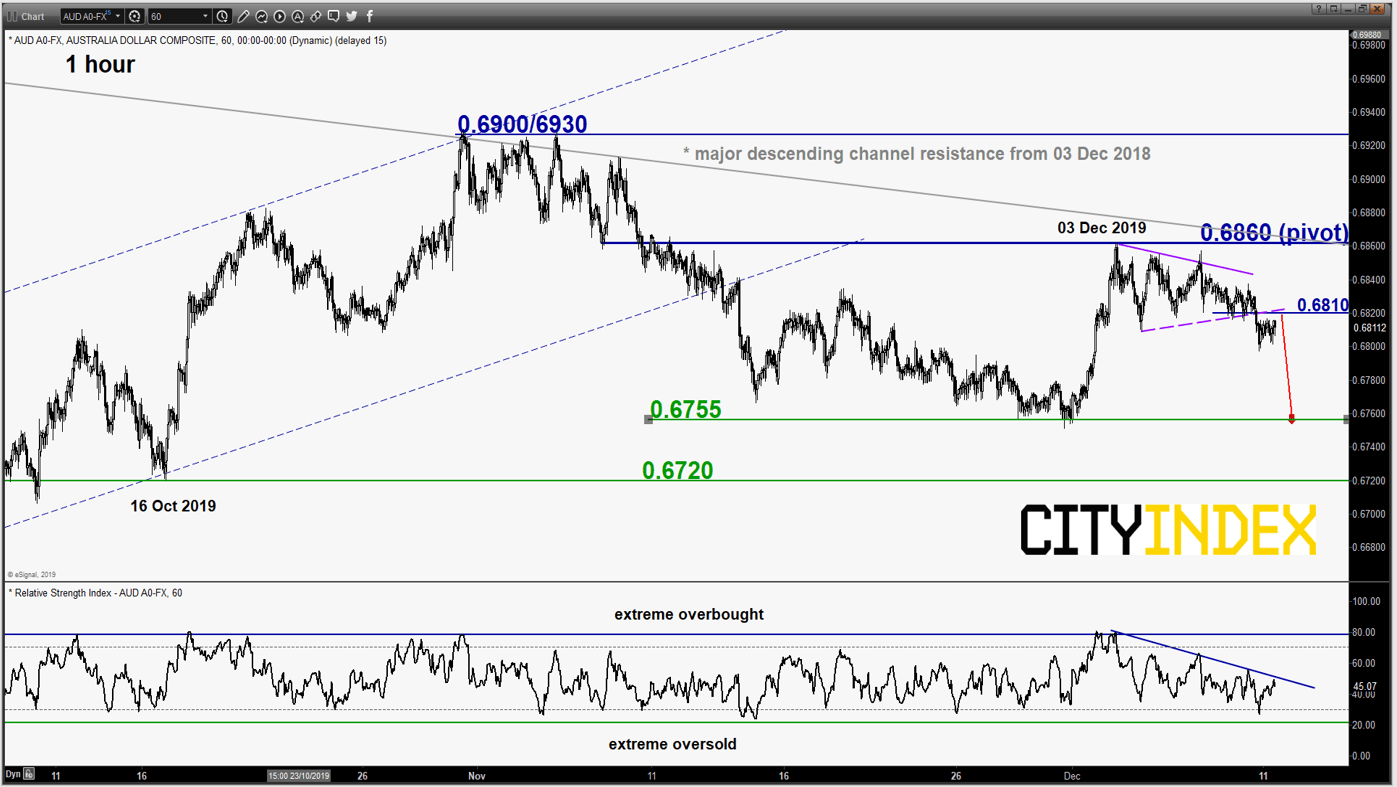
AUD/USD – Minor “Symmetrical Triangle” range bearish breakdown
click to enlarge chart
- The pair has staged a breakdown below the minor “Symmetrical Triangle” range support now turns pull-back resistance at 0.6810.
- Flip to a bearish bias below 0.6860 pivotal resistance (the major descending channel resistance from 03 Dec 2018 high & the 61.8% Fibonacci retracement of the recent slide from 31 Oct high to 29 Nov 2019 low) for a further potential slide to test 0.6755 next.
- On the other hand, a clearance with a daily close above 0.6860 validates a major bullish breakout for an assault towards 0.6900/6930 in the first step.
Charts are from eSignal
Latest market news
Yesterday 03:00 PM
Yesterday 01:12 PM
Yesterday 11:14 AM
Latest EUR articles
April 13, 2024 08:00 PM
March 25, 2024 02:55 AM
January 22, 2024 04:19 AM
January 18, 2024 04:46 AM