


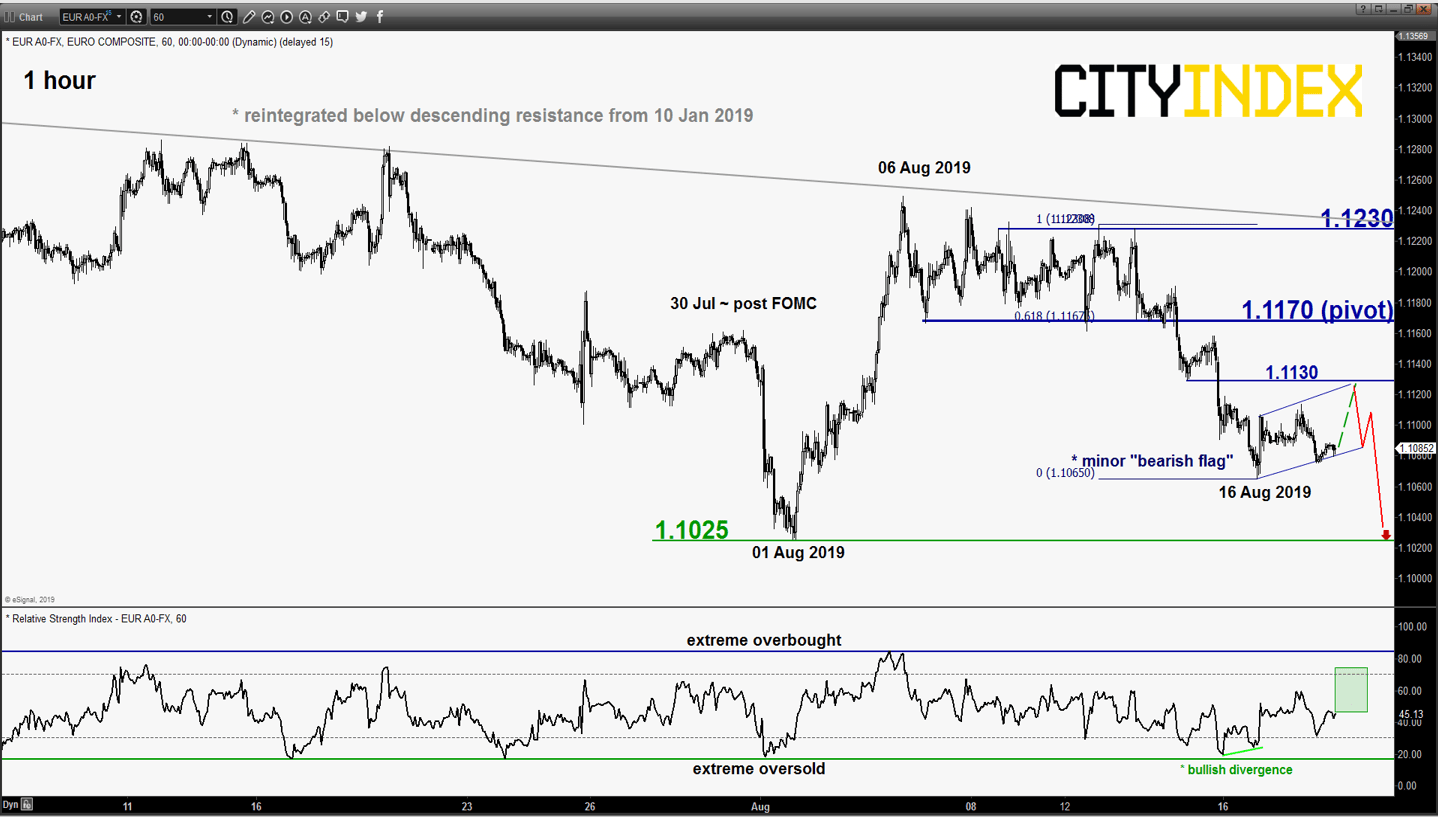
EUR/USD – Potential bounce before new drop
click to enlarge chart
- Since last Fri, 16 Aug low of 1.1065, the pair has staged a rebound of 46 pips within a minor “bearish flag” ascending range configuration with its range top/resistance coming in at 1.1130. In addition, the 1-hour RSI oscillator is suggesting a further potential bounce in play.
- Key short-term pivotal resistance to watch will be at 1.1170 (former minor range support & 61.8% Fibonacci retracement of the recent drop from 12 Aug high to 16 Aug 2019 low) for another potential downleg to retest 1.1025 near-term support in the first step.
- On the other hand, a clearance with an hourly close above 1.1170 negates the bearish tone for an extension of the corrective rebound towards the next resistance at 1.1230 (also the descending trendline from 10 Jan 2019 high).
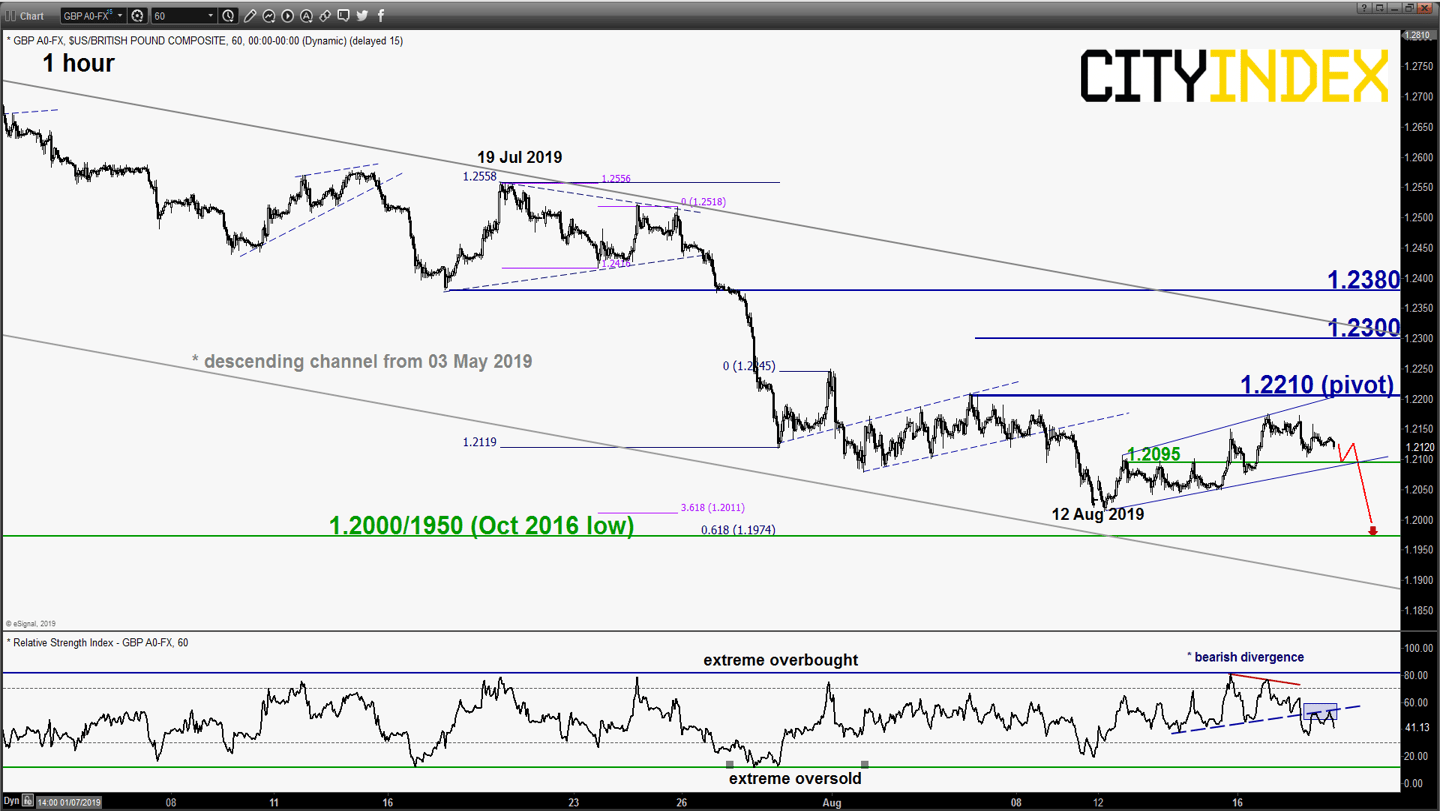
GBP/USD - Bears remain in control
click to enlarge chart
- Since its 12 Aug 2019 low of 1.2013, the pair has evolved onto a corrective “Expanding Wedge” range configuration within a medium-term downtrend in place since May 2019.
- Short-term momentum as indicated by the 1-hour RSI oscillator has turned negative (bearish divergence at the overbought region with a recent breakdown from its corresponding support at the 50 level. Maintain bearish bias below 1.2210 key short-term pivotal resistance and a break below 1.2095 (“Expanding Wedge” support) reinforces the start of another potential impulsive downleg to target the next support at 1.2000/1950.
- On the other hand, a clearance with an hourly close above 1.2210 negates the bearish tone for an extended corrective rebound towards the medium-term descending channel resistance at 1.2300.
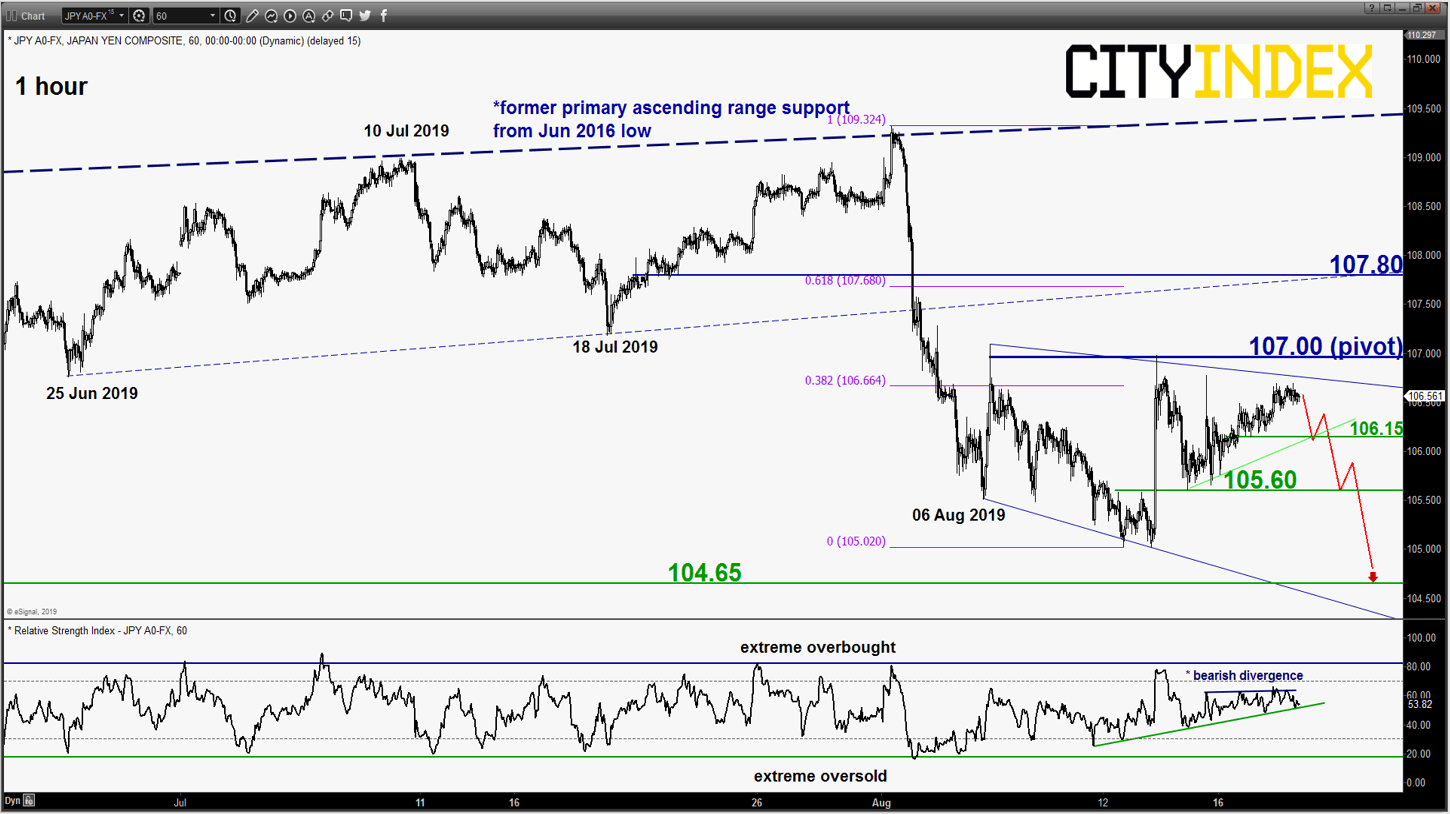
USD/JPY – Recent bounce appears to be losing momentum
click to enlarge chart
- The recent rebound of 190 pips from 13 Aug low is now coming close to significant short-term range resistance at 107.00 with short-term upside momentum that has started to wane as indicated by the bearish divergence signal seen in the 1-hour RSI oscillator.
- Bearish bias below 107.00 key short-term pivotal resistance and a break below 106.15 is likely to see a potential drop towards 105.60 follow by 104.65 support (03 Jan 2019 flash crash low area & 22/23 Jan 2018 swing low). On the other hand, a clearance with an hourly close above 107.00 sees a squeeze up towards 107.80.
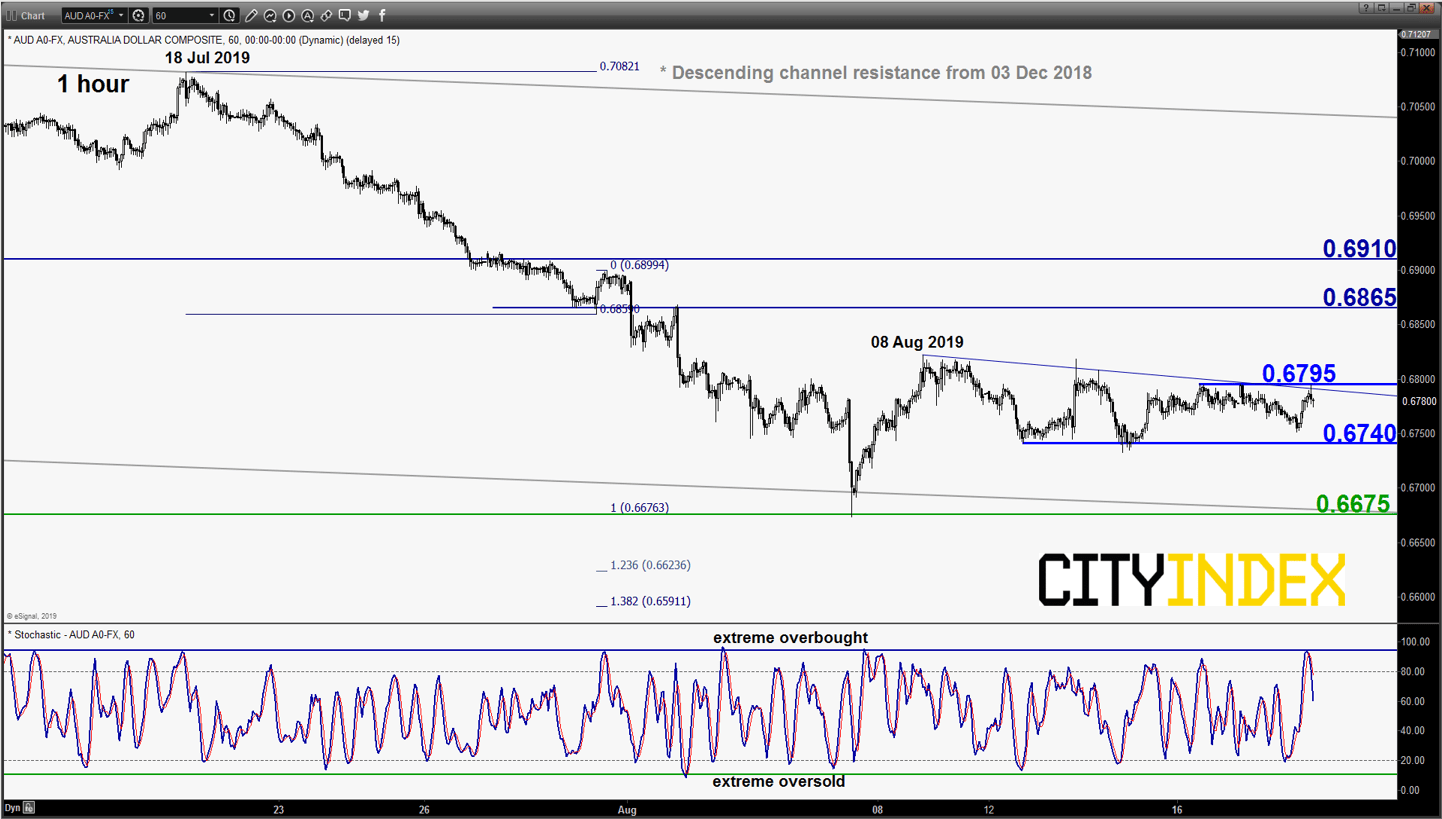
AUD/USD – Sideways
click to enlarge chart
- Since its 08 Aug 2019 high of 0.6822, the pair has started to evolve within a minor “triangle” range configuration with upper and lower limits at 0.6795 and 0.6740 respectively.
- Prefer to turn neutral now between 0.6795 and 0.6740. Only an hourly close above 0.6795 validates a potential corrective rebound towards the next intermediate resistance at 0.6865.
Charts are from eSignal
Latest market news
Today 01:15 PM
Today 11:30 AM
Today 08:18 AM
Latest USD articles
Today 01:15 PM

April 19, 2024 01:23 PM
April 18, 2024 11:27 PM