


EUR/USD – Minor corrective bounce target met with mix elements
click to enlarge chart
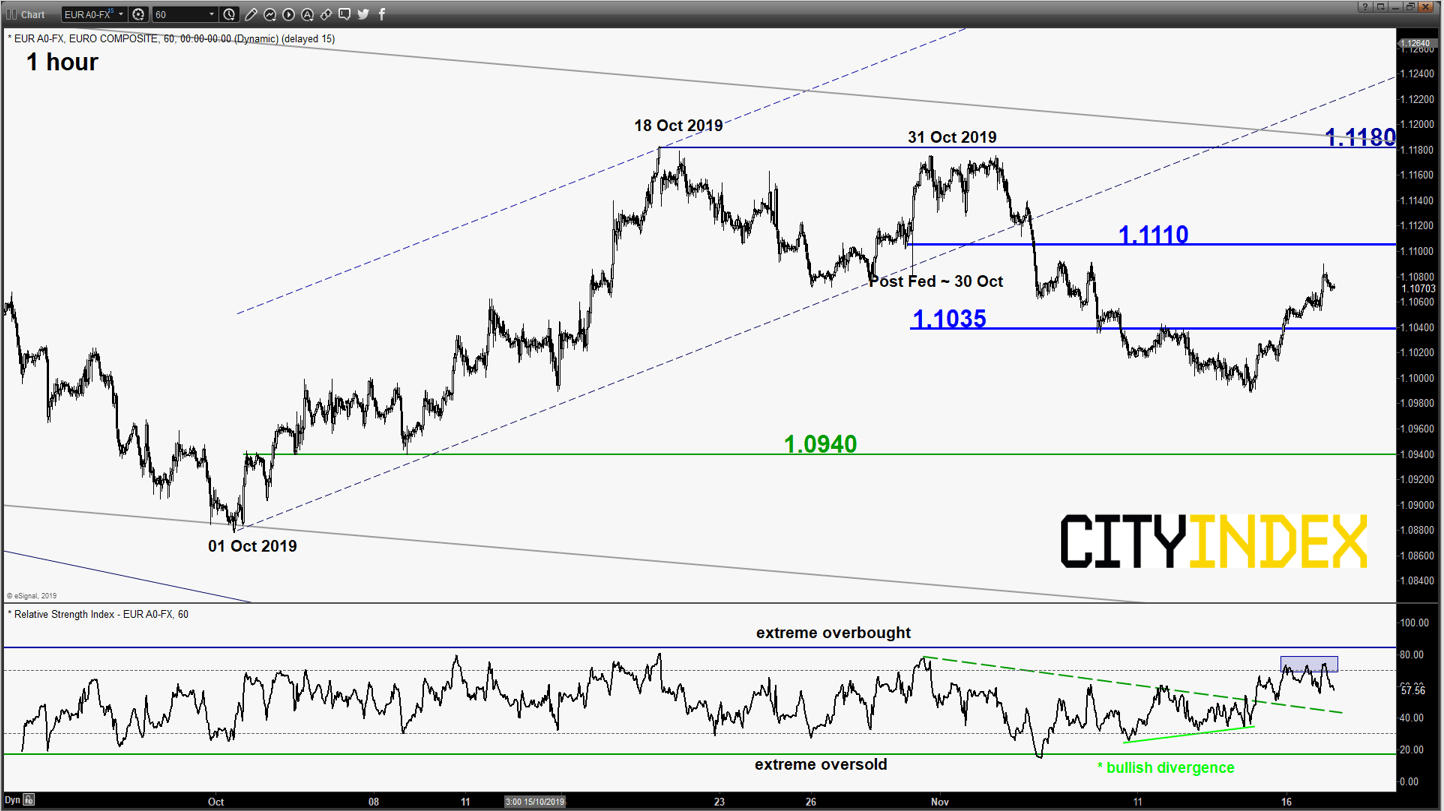
- The pair has staged the expected push up and met the lower limit of the target/resistance at 1.1090 as per highlighted in our previous report (click here for a recap),
- Mix elements as the hourly RSI oscillator has flashed a bearish divergence signal at its overbought region that indicates a slow-down in short-term upside momentum of price action.
- Prefer to turn neutral first between 1.1110 and 1.1035. A clearance above 1.1110 sees a further push up to test a major resistance at 1.1180 (18/31 Oct 2019 swing high area & the upper boundary of a descending channel from 24 Sep 2018 high). On the flipside, a break below 1.1035 triggers the start of another potential impulsive downleg to target the next support at 1.0940 in the first step.
GBP/USD – 1.2910 resistance taken out, bullish flag breakout
click to enlarge chart
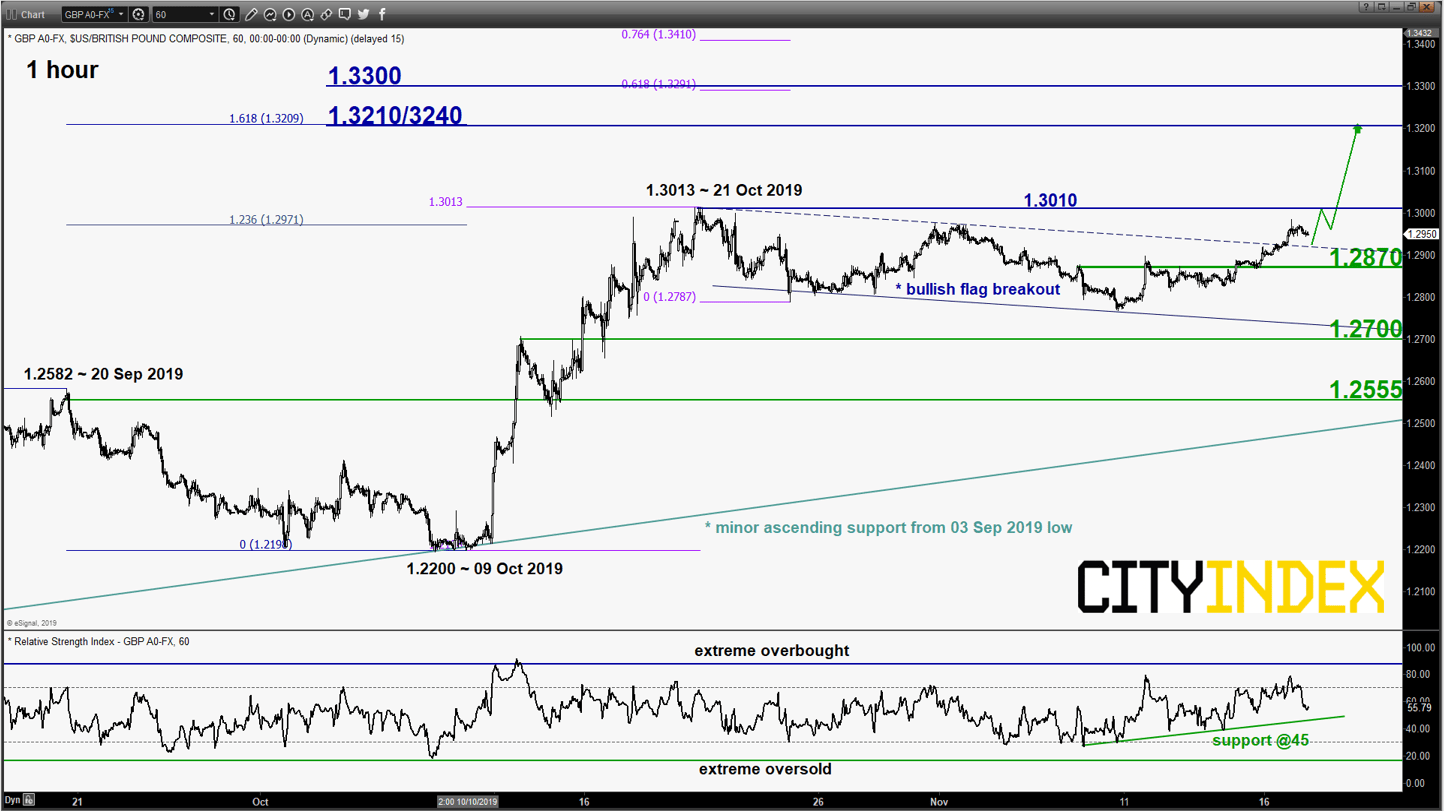
- The pair has broken above the 1.2910 key short-term resistance which has invalidated the minor corrective decline sequence in motion since 21 Oct 2019 high of 1.3013. Current price action has staged a bullish breakout from a minor “bullish flag” range configuration.
- Flip to a bullish bias above 1.2870 key short-term pivotal support (61.8% retracement of the recent push up from 09 Nov low to 18 Nov high) for a further potential push up to target the next resistance at 1.3210/3240 (3 Apr/03 May 2019 swing high area & Fibonacci expansion).
- On the other hand, failure to hold at 1.2870 and an hourly close below it implies a failure bullish breakout to see the continuation of the corrective decline towards the next support at 1.2700.
USD/JPY – At risk of shaping another impulsive downleg
click to enlarge chart
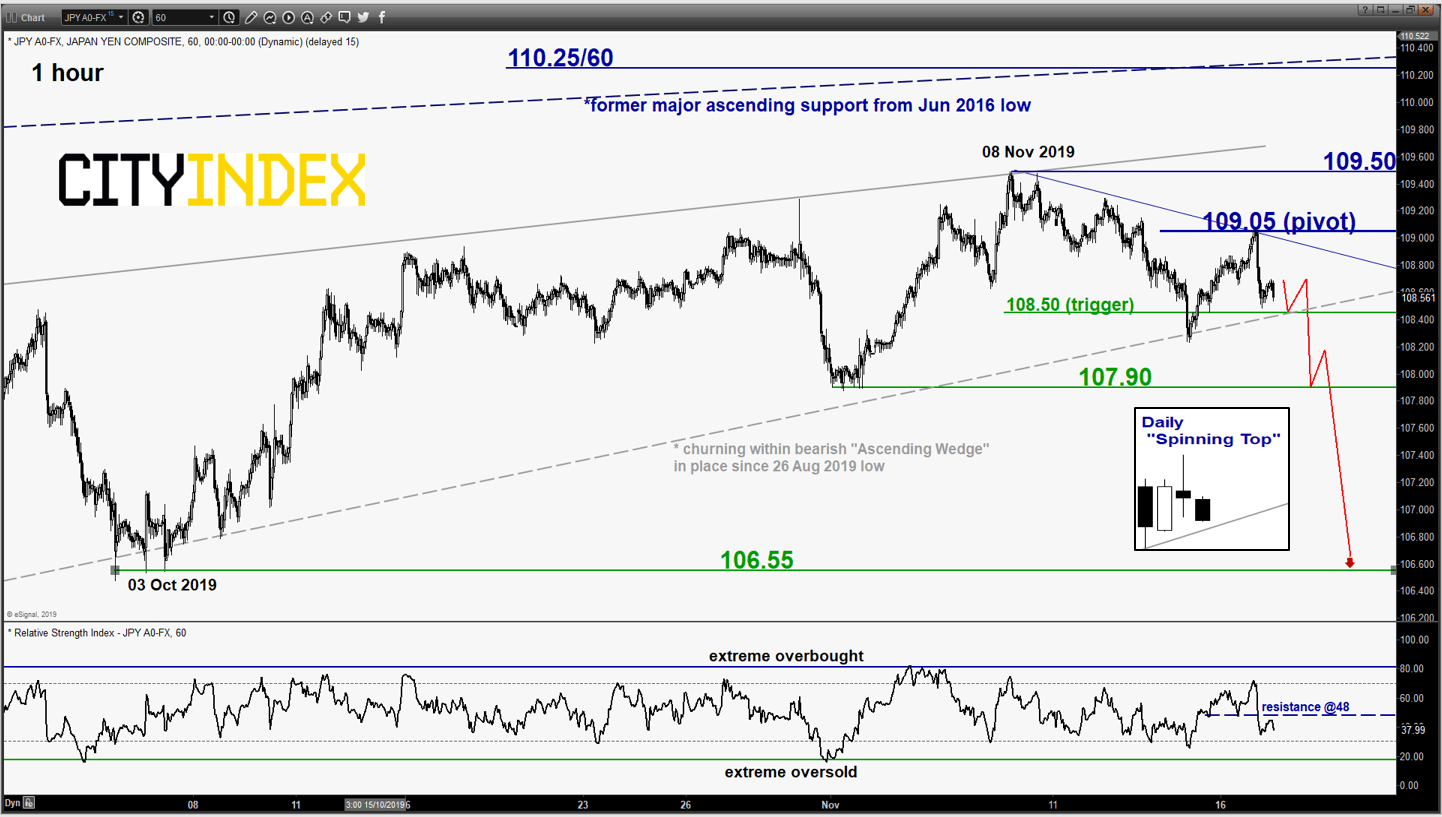
- The recent push up of by around 80 pips from its 14 Nov minor swing low area of 108.25 has stalled at the 61.8% Fibonacci retracement of the recent slide from 08 Nov high to 15 Nov low and the minor descending trendline from 08 Nov high.
- In addition, it has ended yesterday, 19 Nov U.S. session with a daily “Spinning Top” candlestick pattern that indicates the bulls has turned “indecisive” to push the price action higher. Maintain bearish bias below 109.05 key short-term pivotal resistance and added a downside trigger level at 108.50 to reinforce a bearish break down from the “Ascending Wedge” lower boundary to target the next supports at 107.90 and 106.55.
- However, a clearance above 109.05 negates the bearish tone for a push up to retest 109.50.
AUD/USD – Further potential push down below 0.6845
click to enlarge chart
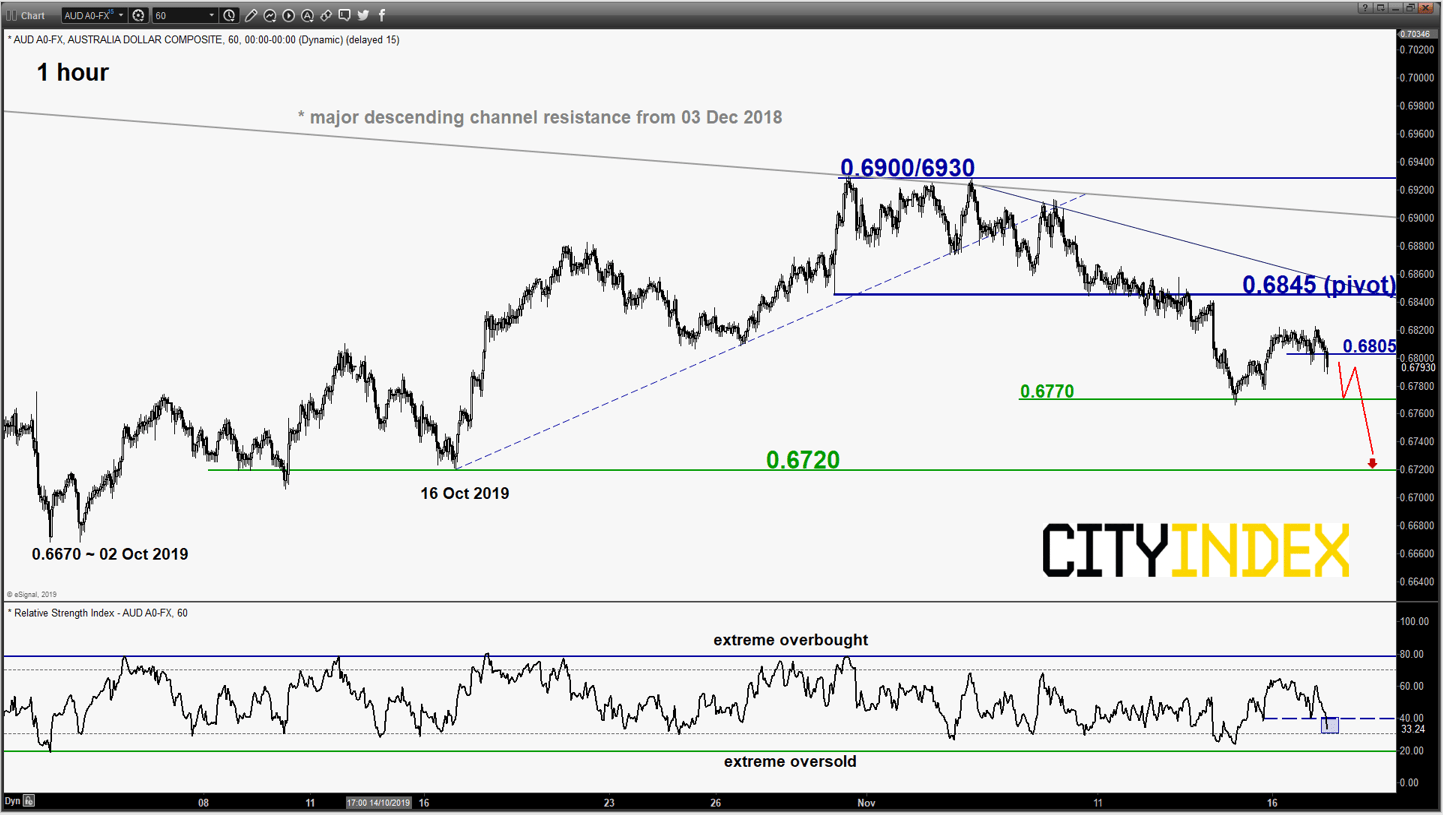
- The pair has staged a bounce of around 50 pips from its 14 Nov minor swing low area of 0.6770 but remained below the 0.6845 key short-term pivotal resistance as per highlighted in our previous report.
- Maintain bearish bias for a further potential push down to retest 0.6670 before targeting the next near-term support at 0.6720 (minor swing area of 16 Oct 2019 and the 76.4% Fibonacci retracement of the recent rebound from 02 Oct low to 31 Oct 2019 high).
- However, a clearance with an hourly close above 0.6845 negates the bearish tone for squeeze up to retest 0.6900/6930 (31 Oct/05 Nov 2019 swing high & the major descending channel resistance from 03 Dec 2018 high).
Charts are from eSignal
Latest market news
Today 08:33 AM
Latest EUR articles
April 13, 2024 08:00 PM
March 25, 2024 02:55 AM
January 22, 2024 04:19 AM
January 18, 2024 04:46 AM