


GBP/USD – At risk of shaping a medium-term pull-back
click to enlarge charts
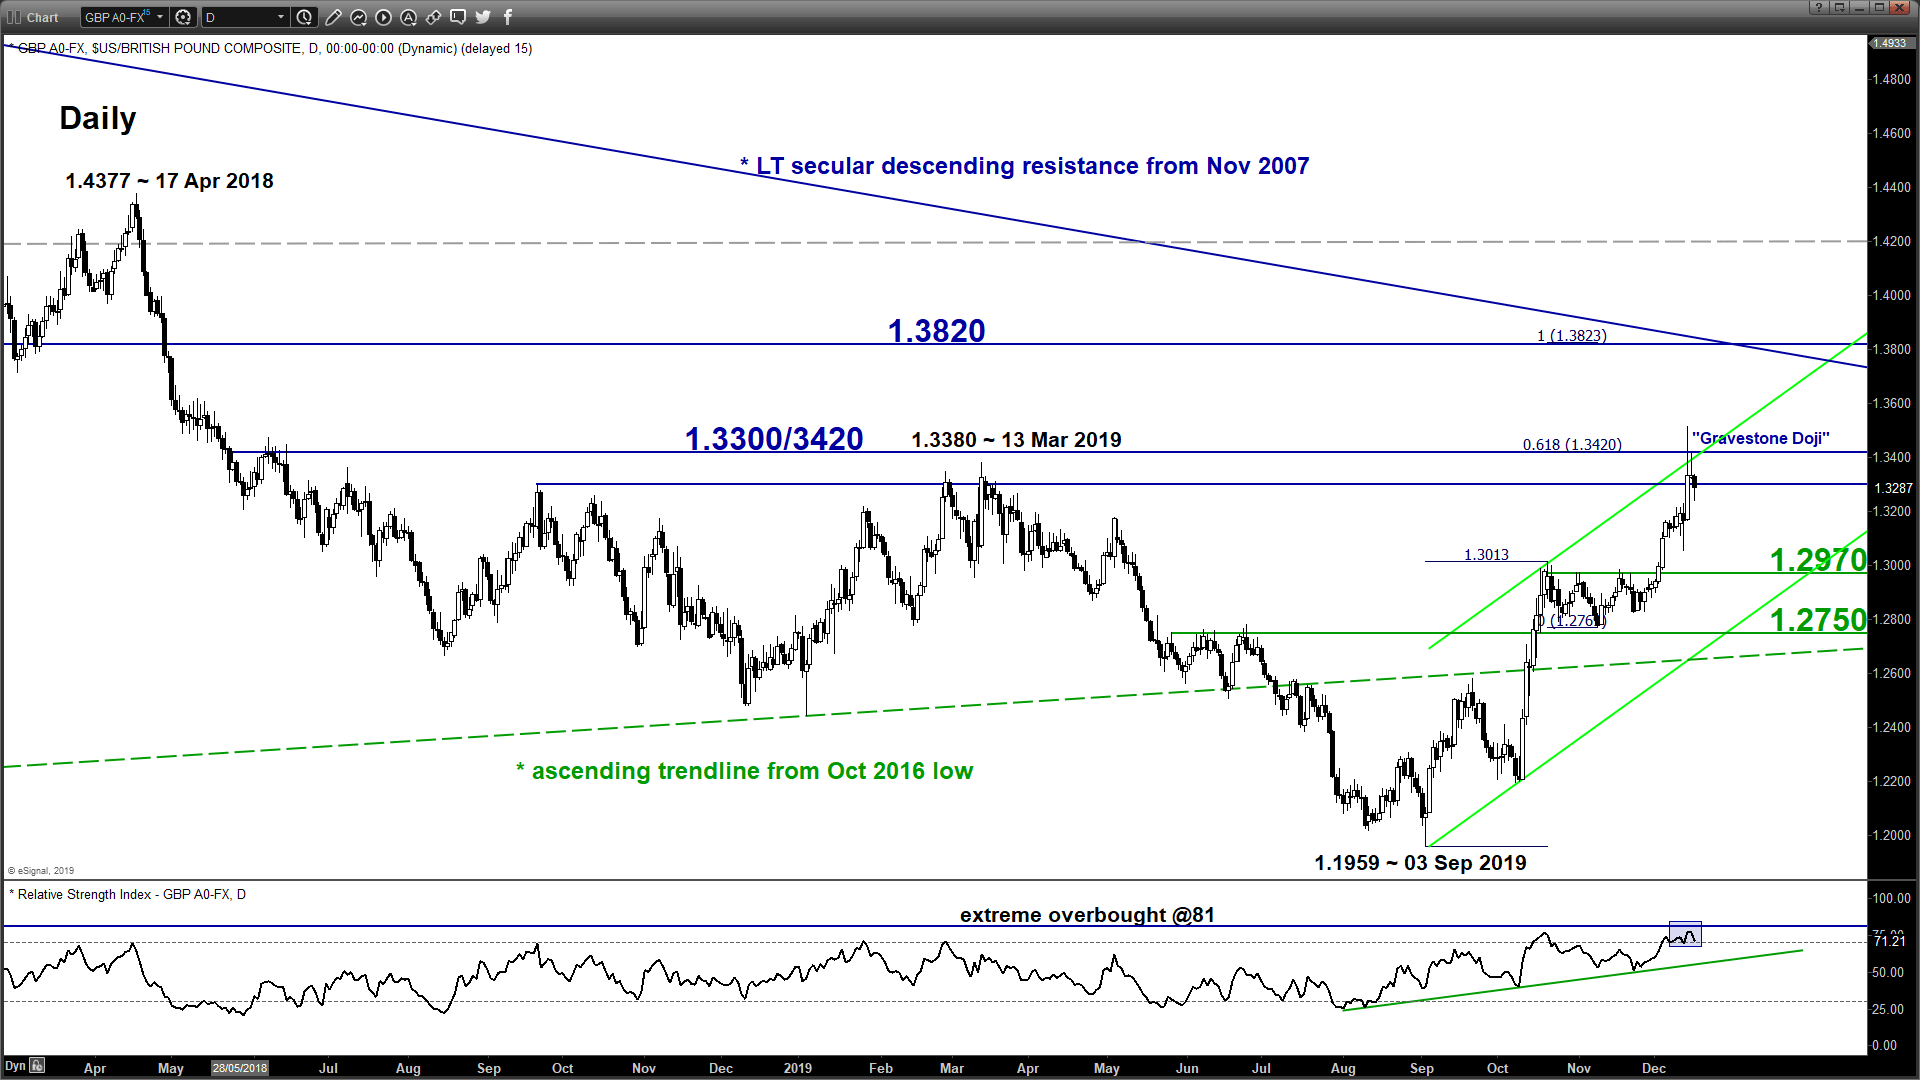
- The pair has rallied up towards the expected target/resistance of 1.3300 as per highlighted in our previous report (click here for a recap). It has printed an intraday high of 1.3515 on last Fri, 13 Dec early Asian session when exit poll has indicated a majority win for the PM Johnson’s Conservative Party in UK General Election. Thereafter, it has dipped by 273 pips to print a current intraday low of 1.3235 in today’s Asian session.
- Last Fri’s swing high of 1.3515 has coincided with a significant medium-term resistance zone of 1.3300/3420 (the range top from 20 Sep 2018/13 Mar 2019, upper boundary of the ascending channel from 03 Sep 2019 low & a Fibonacci expansion cluster), refer to daily chart.
- It has formed a daily bearish “Gravestone Doji” at the end of yesterday, 16 Dec U.S session coupled with an overbought reading seen in the daily RSI oscillator right at the 1.3300/3420 resistance zone.
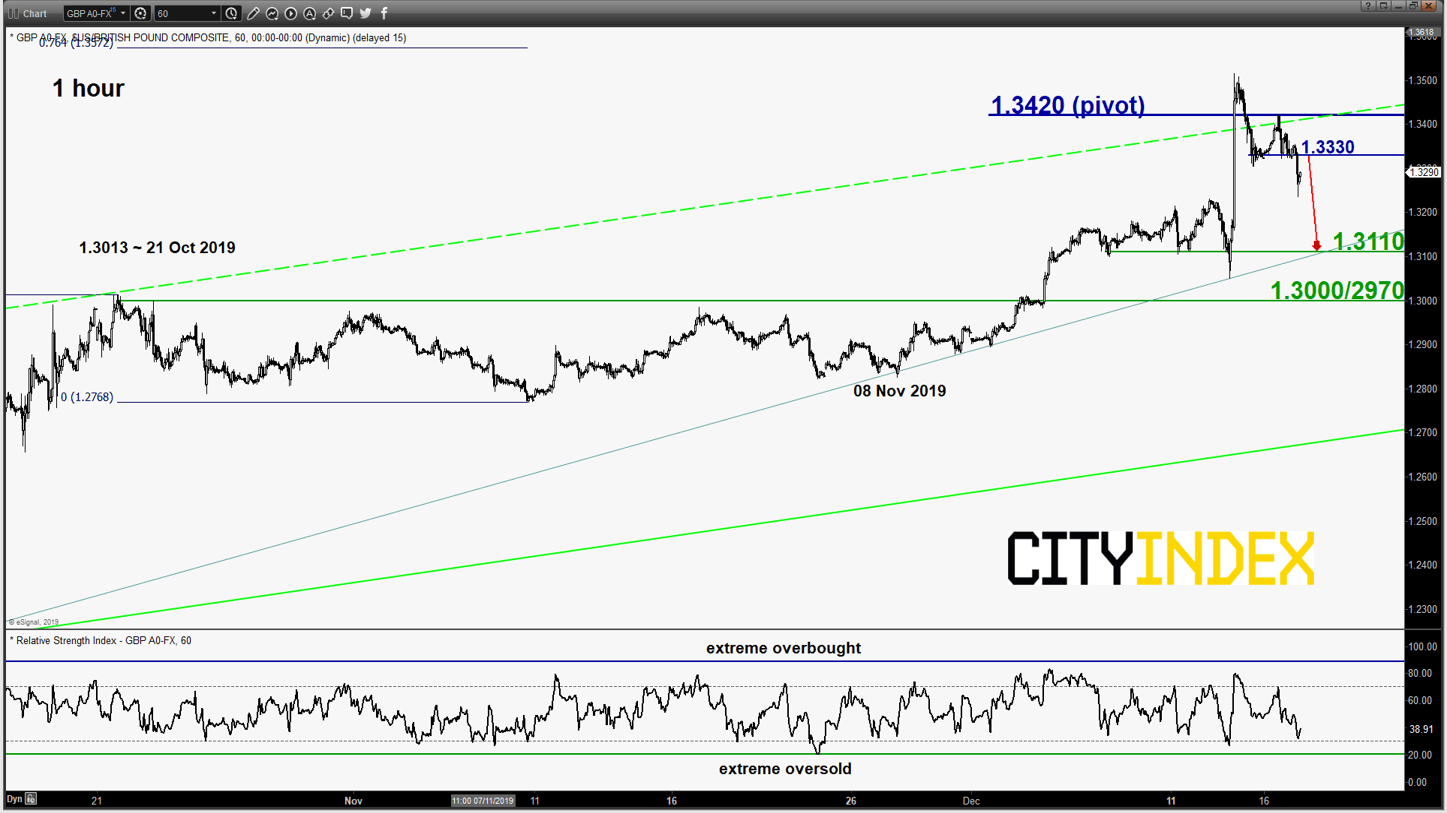
- At risk of shaping a medium-term/multi-week pull-back, flip to a bearish bias with 1.3420 as the pivotal resistance for a potential push down to target the next near-term support at 1.3110 in the first step. On the other hand, an hourly close above 1.3420 invalidates the bearish tone for a further squeeze up to retest 1.3515 before targeting the major resistance at 1.3820.
EUR/USD – Stalled at major resistance
click to enlarge charts
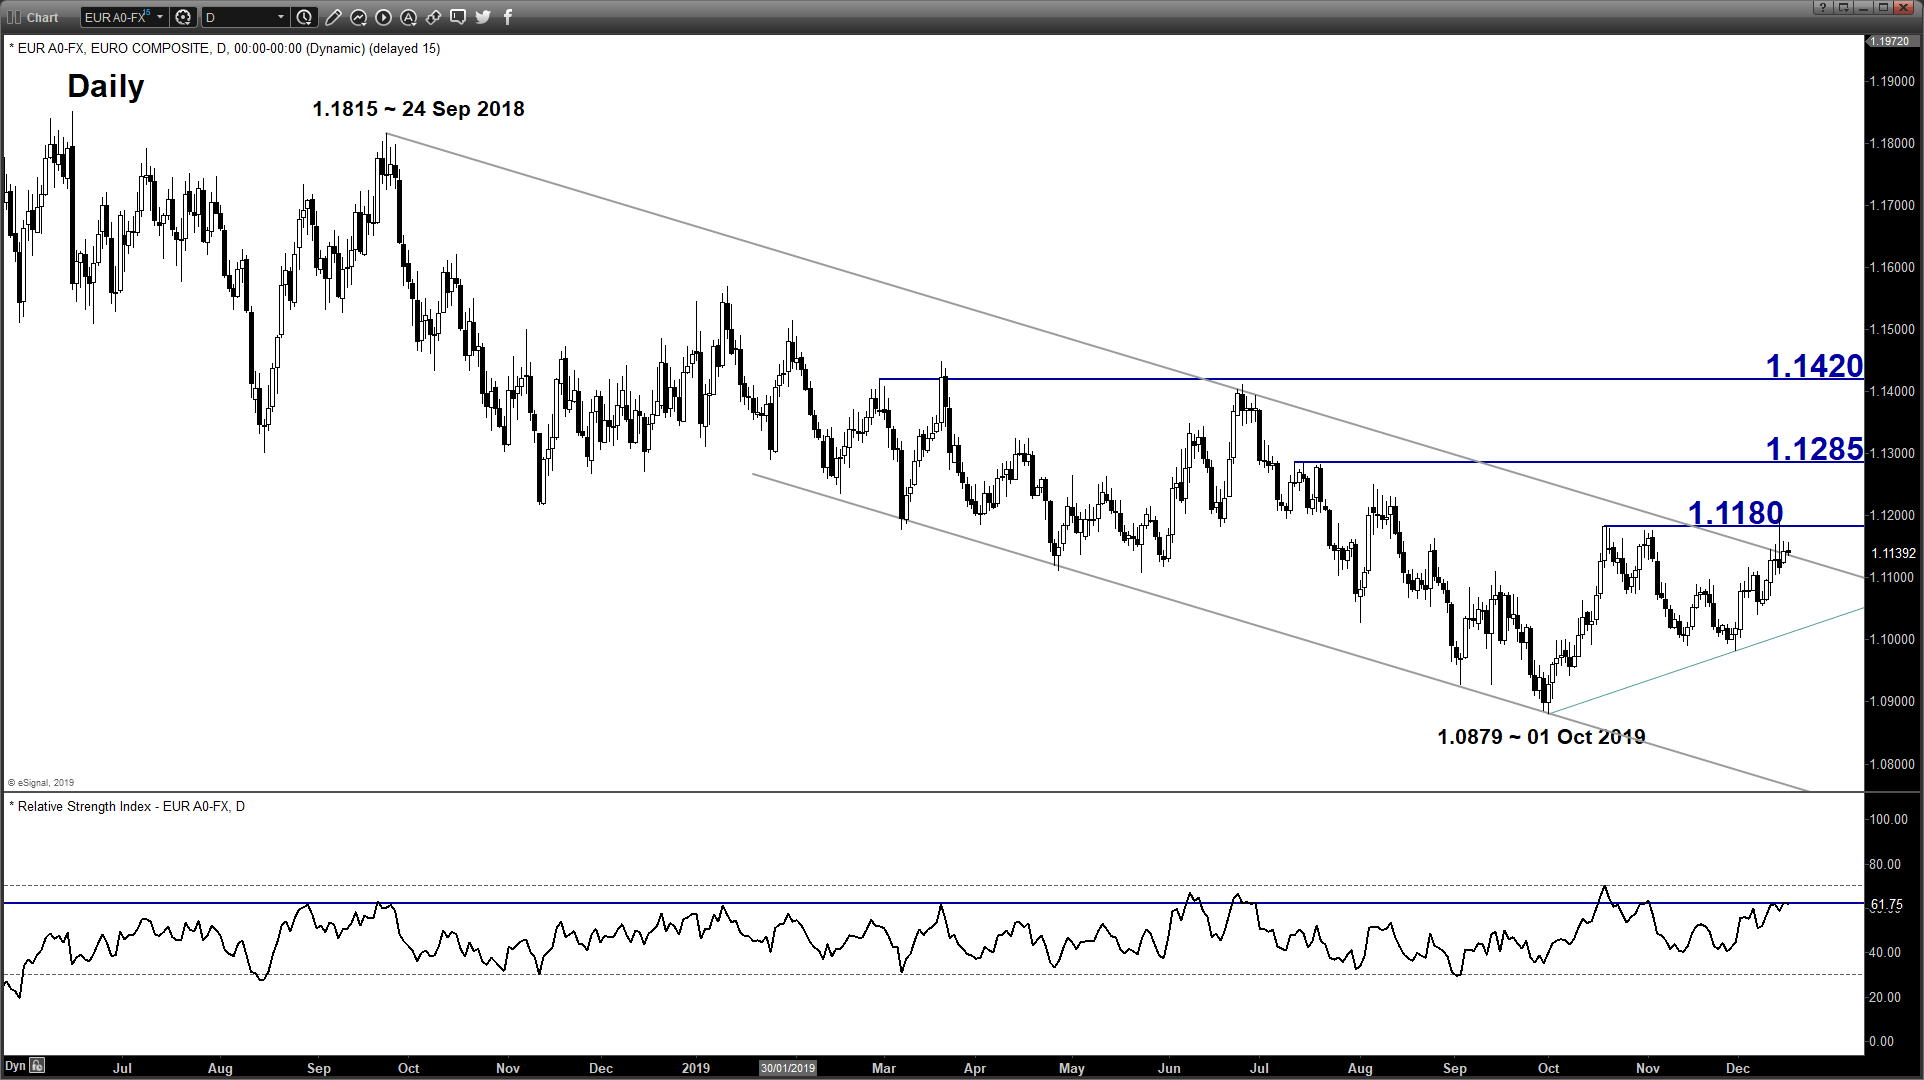
- The pair has broken out of the short-term neutrality zone upper limit of 1.1110 as per highlighted in our previous report and spiked up towards the 1.1160/1180 resistance zone.
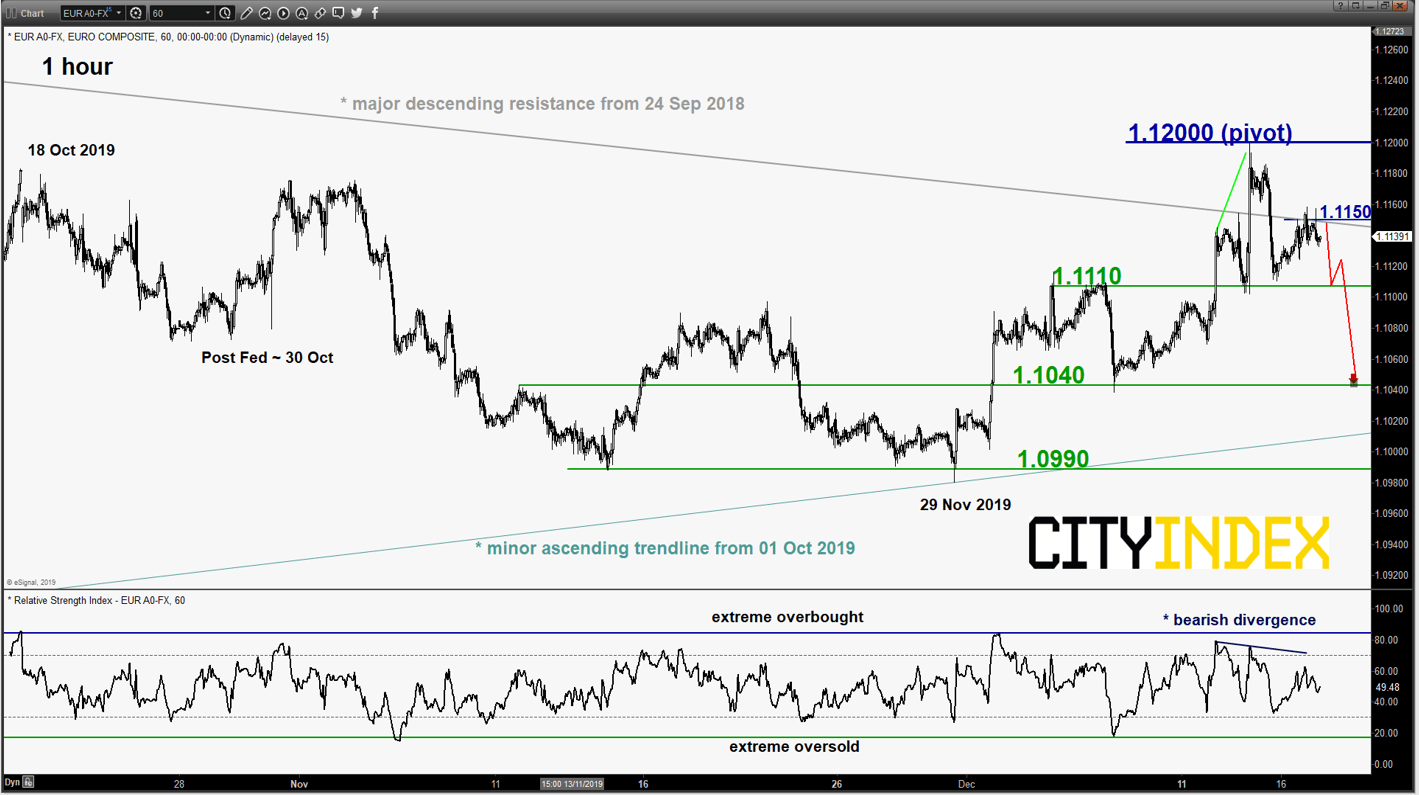
- The pair has printed an intraday high of 1.1200 on last Fri, 13 Dec and stalled right at the upper boundary of the major descending channel from 24 Sep 2018. In addition, the hourly RSI oscillator has traced out a bearish divergence signal at its overbought region.
- Bearish bias in any bounces below 1.1200 pivotal resistance for a potential push down to test 1.1110 near-term support and a break below it reinforces a further slide to target the next support at 1.1040. On the other hand, a daily close above 1.1200 sees a bullish breakout for a further push up towards the next intermediate resistance at 1.1285.
USD/JPY – Potential push down within range configuration
click to enlarge charts
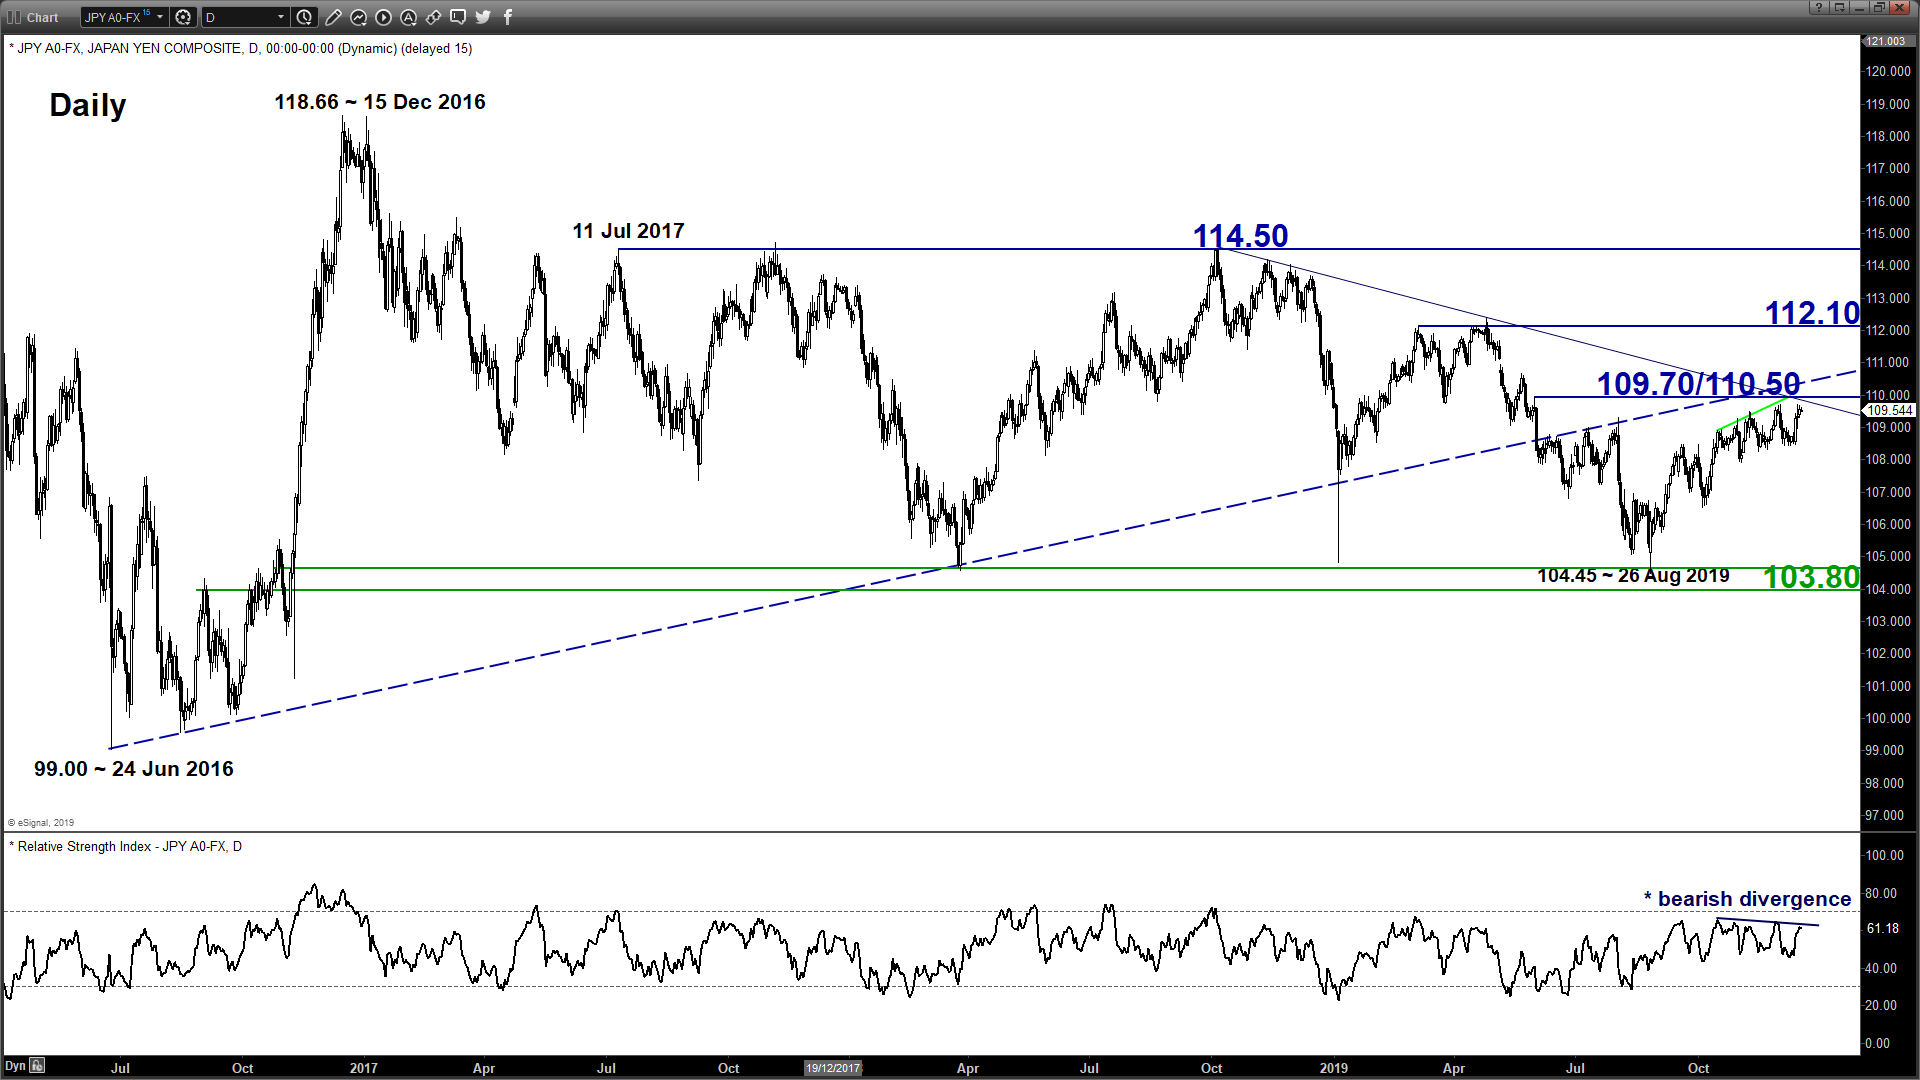
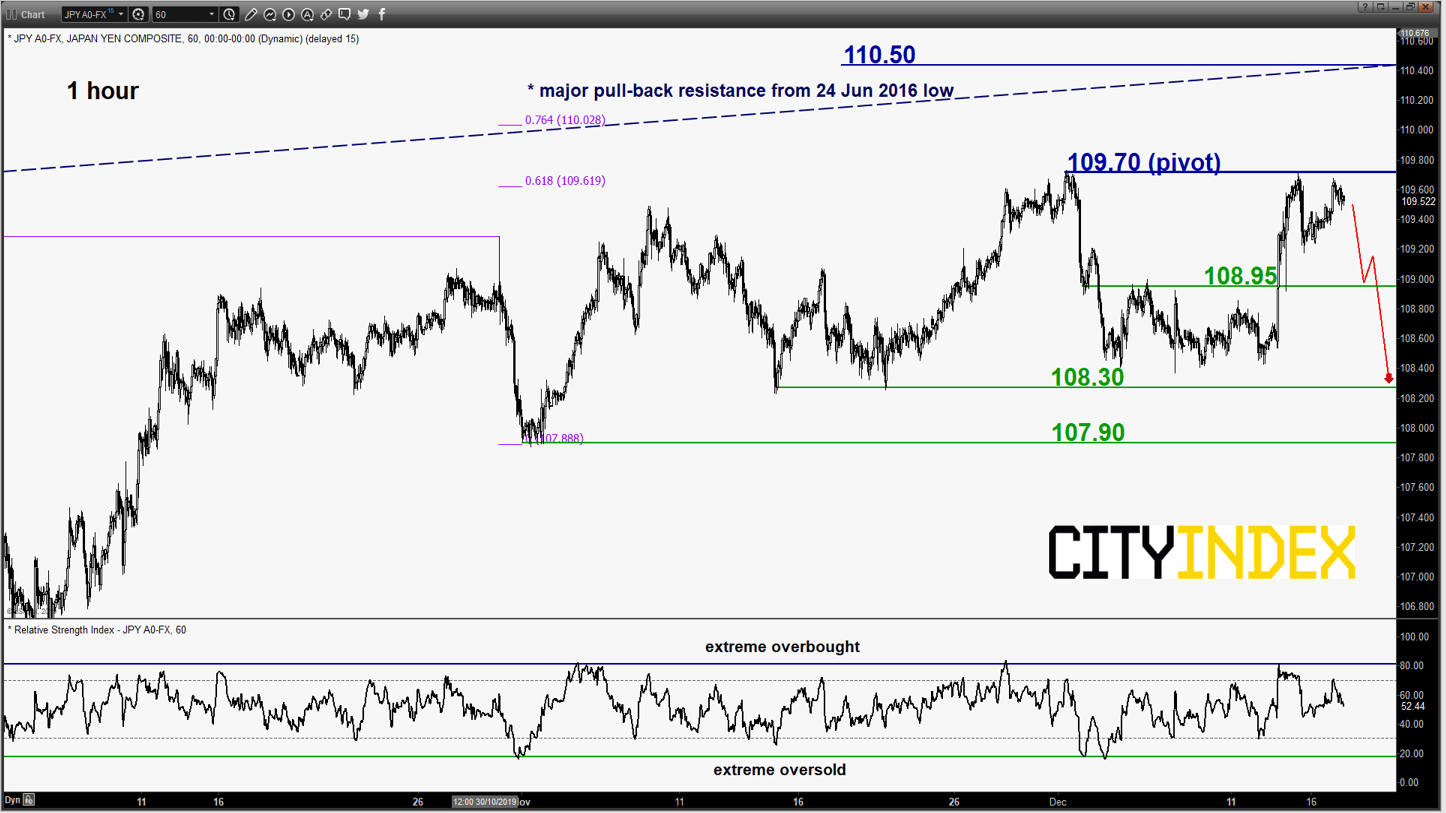
- The pair has broken above the 109.00 upper limit of the minor neutrality range and hit the 109.70 resistance as per highlighted in our previous report. Medium-term upside momentum has started to abate again as indicated by the bearish divergence signal seen in the daily RSI oscillator near its overbought region.
- Flip to a bearish bias with 109.70 as the short-term pivotal resistance for a potential push down to retest 108.95 and below it sees a further slide to retest the minor range support area of 108.30. On the other hand, an hourly close above 109.70 negates the bearish tone for a further squeeze up to test the 110.50 major resistance.
AUD/USD – Mix elements, turn neutral first
click to enlarge chart
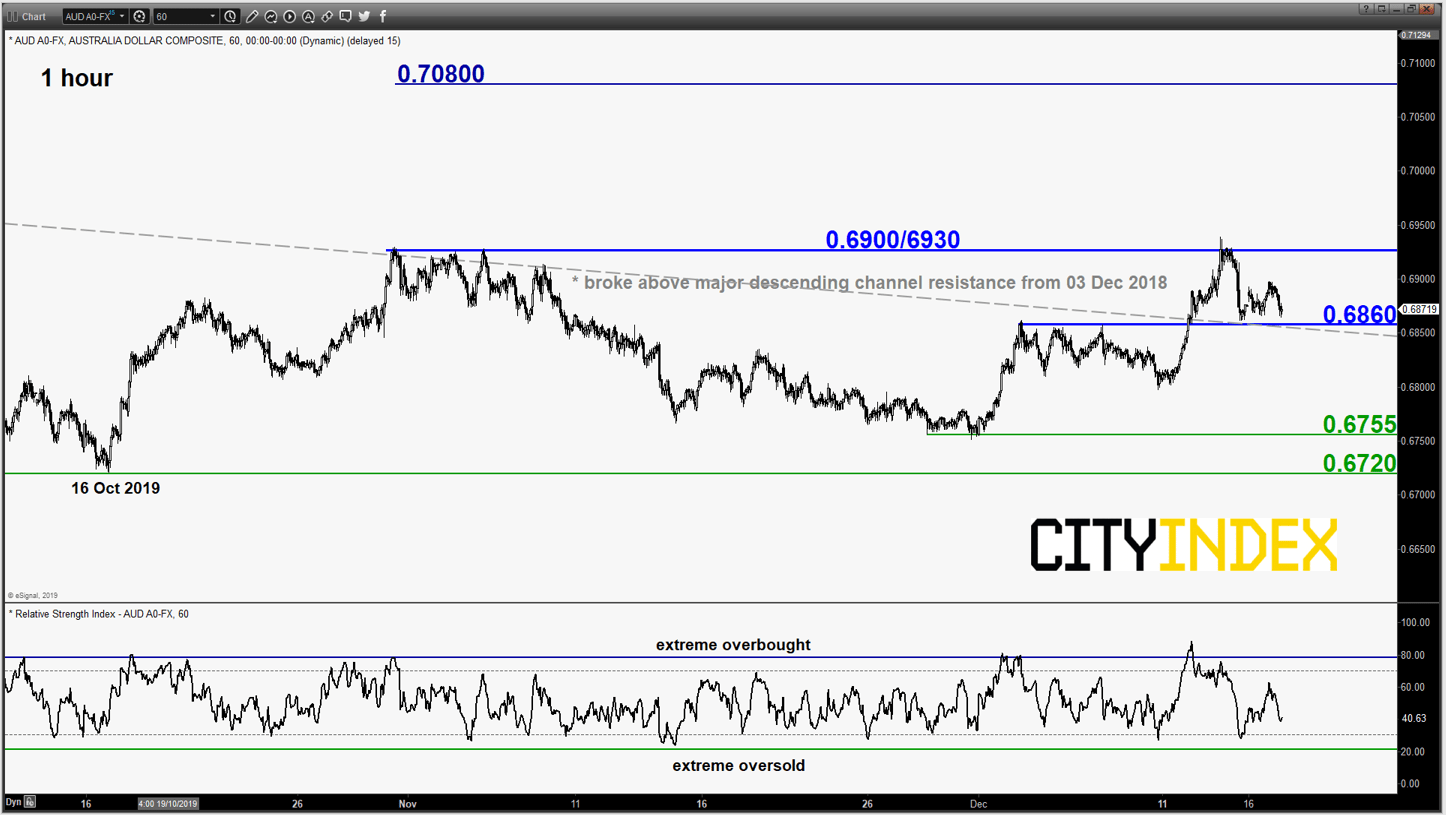
- The pair has staged a breakout above the 0.6860 major descending channel resistance that has invalidated the bearish scenario as per highlighted in our previous report.
- It has rallied towards the alternate target of 0.6900/6930 which is defined by the minor range top of 31 Oct/05 Nov 2019 with mix elements. Prefer to turn neutral first between 0.6930 and 0.6860. An hourly close above 0.6930 sees a further push up to target the next resistance at 0.7080 (18 Jul 2019 medium-term swing high). On the flipside, a break below 0.6860 invalidates the bullish breakout for a slide back into the range configuration to retest 0.6755/6720 support.
Charts are from eSignal
Latest market news
Today 11:14 AM
Today 08:28 AM
Yesterday 03:30 PM
Latest EUR articles
April 13, 2024 08:00 PM
March 25, 2024 02:55 AM
January 22, 2024 04:19 AM
January 18, 2024 04:46 AM