


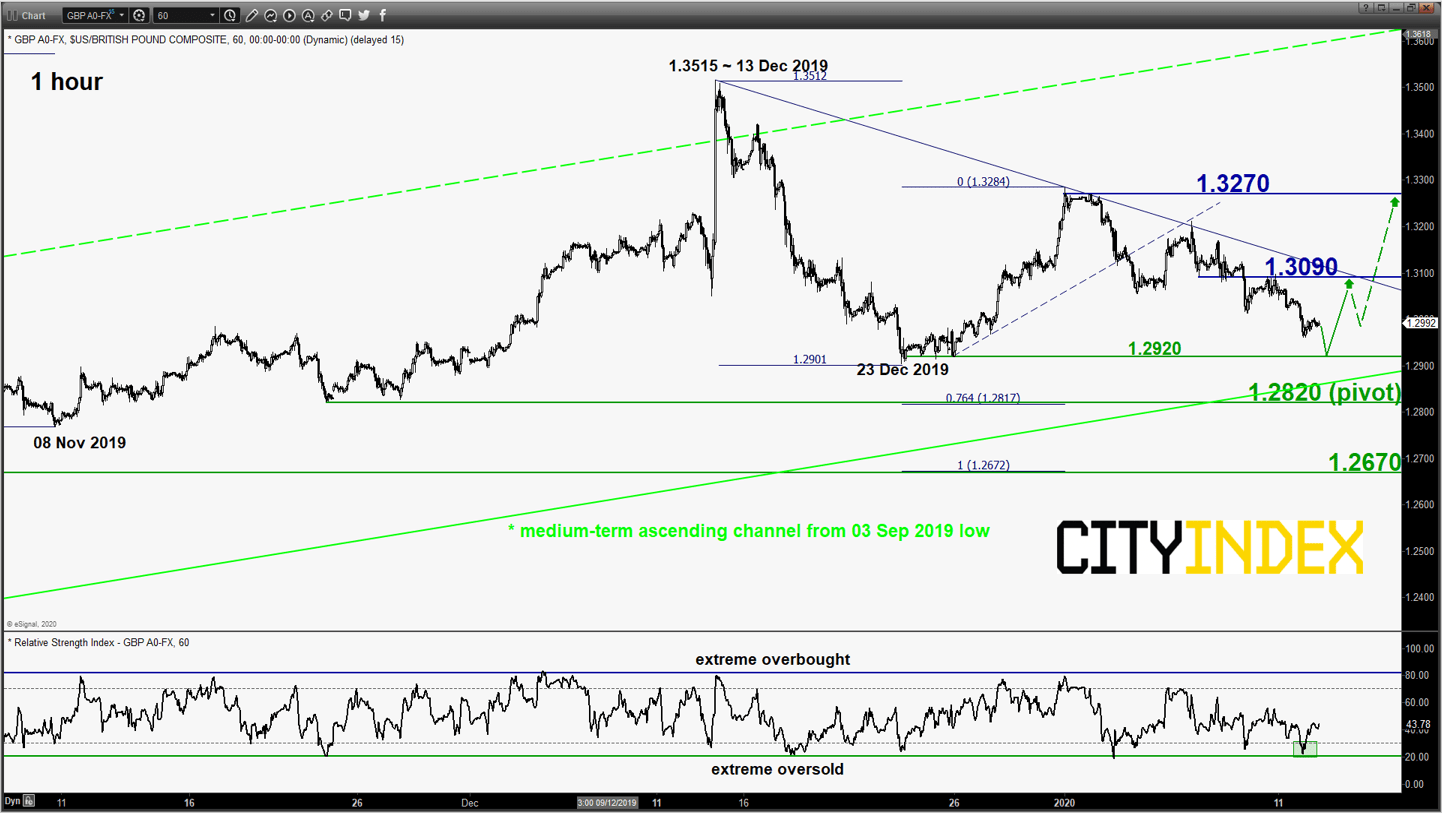
GBP/USD – Potential rebound around the corner
click to enlarge chart
- The pair has staged the push down as expected and almost hit the short-term target/support of 1.2920 as per highlighted in our report (click here for a recap). It printed an intraday low of 1.2959 yesterday, 13 Jan on the backdrop of dovish comments from BOE officials.
- The 300+ pips of decline from the 31 Dec 2019 minor swing high is now approaching the lower boundary of the medium-term ascending channel in place since 03 Sep 2019 low with the hourly RSI oscillator that has tested an extreme oversold level thrice. Flip to a bullish bias with 1.2820 as the key short-term pivotal support for a potential rebound towards 1.3090 (minor congestion zone & descending resistance from 13 Dec 2019 high). An hourly close above 1.3090 reinforces a further potential recovery to target 1.3270 next in the first step.
- On the other hand, a break with an hourly close below 1.2820 opens up scope for a further slide towards the next support at 1.2670/2560 (1.00 Fibonacci expansion of the recent decline from 13 Dec 2019 high & 61.8% Fibonacci retracement of the multi-month up move from 03 Sep 2019 low to 13 Dec 2019 high).
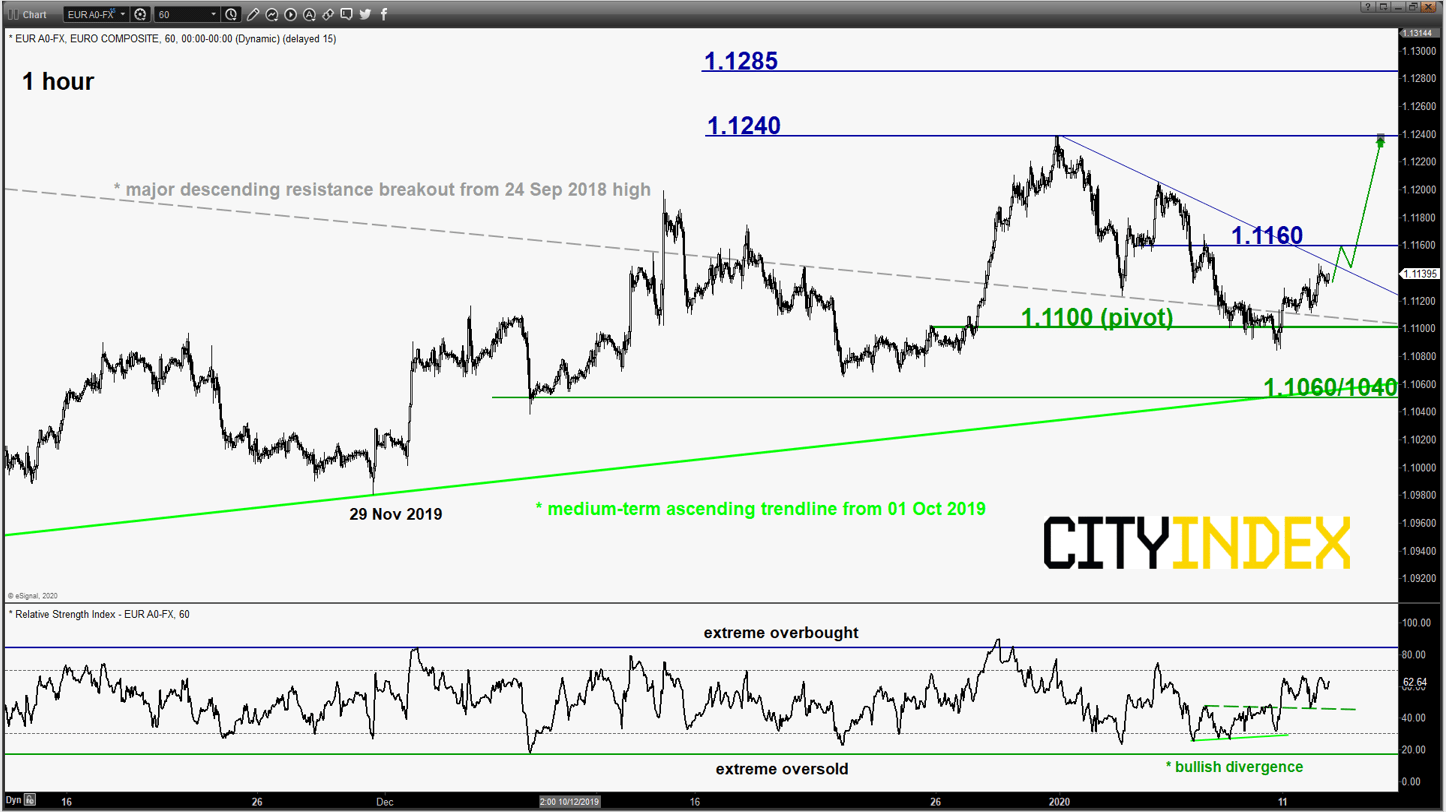
EUR/USD – Potential bullish breakout above 1.1160
click to enlarge chart
- The pair has started to shape a rebound of 60 pips from the 1.1100 lower limit of the short-term neutrality zone as per highlighted in our previous report; also the pull-back support of the former major descending resistance from 24 Sep 2018 high.
- Elements have turned positive; flip to a bullish bias with 1.1100 as the key short-term pivotal support and a break with an hourly close above 1.1160 reinforces the potential recovery to retest the 31 Dec 2019 swing high of 1.1240.
- On the other hand, a break with an hourly close below 1.1100 invalidates the bullish scenario for a further slide towards 1.1060/1040 (medium-term ascending trendline from 01 Oct 2019 low).
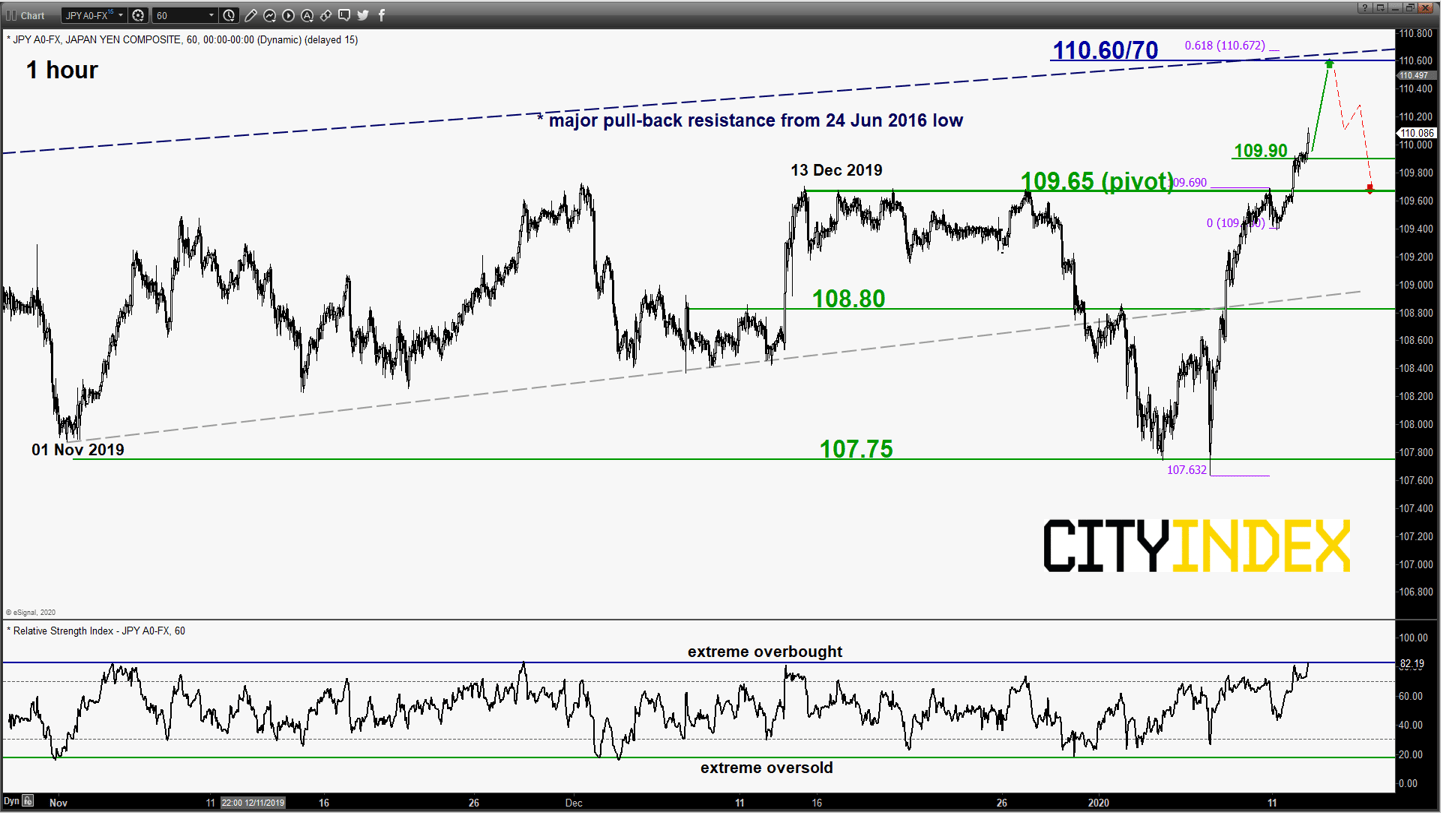
USD/JPY – Further potential residual push up towards major resistance
click to enlarge chart
- The pair has broken above the 109.70 minor range resistance in place since 13 Dec 2019 (the upper neutrality zone as per highlighted in our previous report). Flip to bullish bias now in any dips above 109.65 key short-term pivotal support for a further potential residual push up to target the major resistance at 1110.60/70 (former ascending support from 24 Jun 2016 low, 21 May 2019 swing high, secular descending resistance from 05 Jun 2015 high & a Fibonacci expansion/retracement cluster) before a corrective decline materialises.
- On the other hand, a break with an hourly close below 109.65 invalidates the residual push up scenario for a corrective decline towards the 108.80 near-term support in the first step.
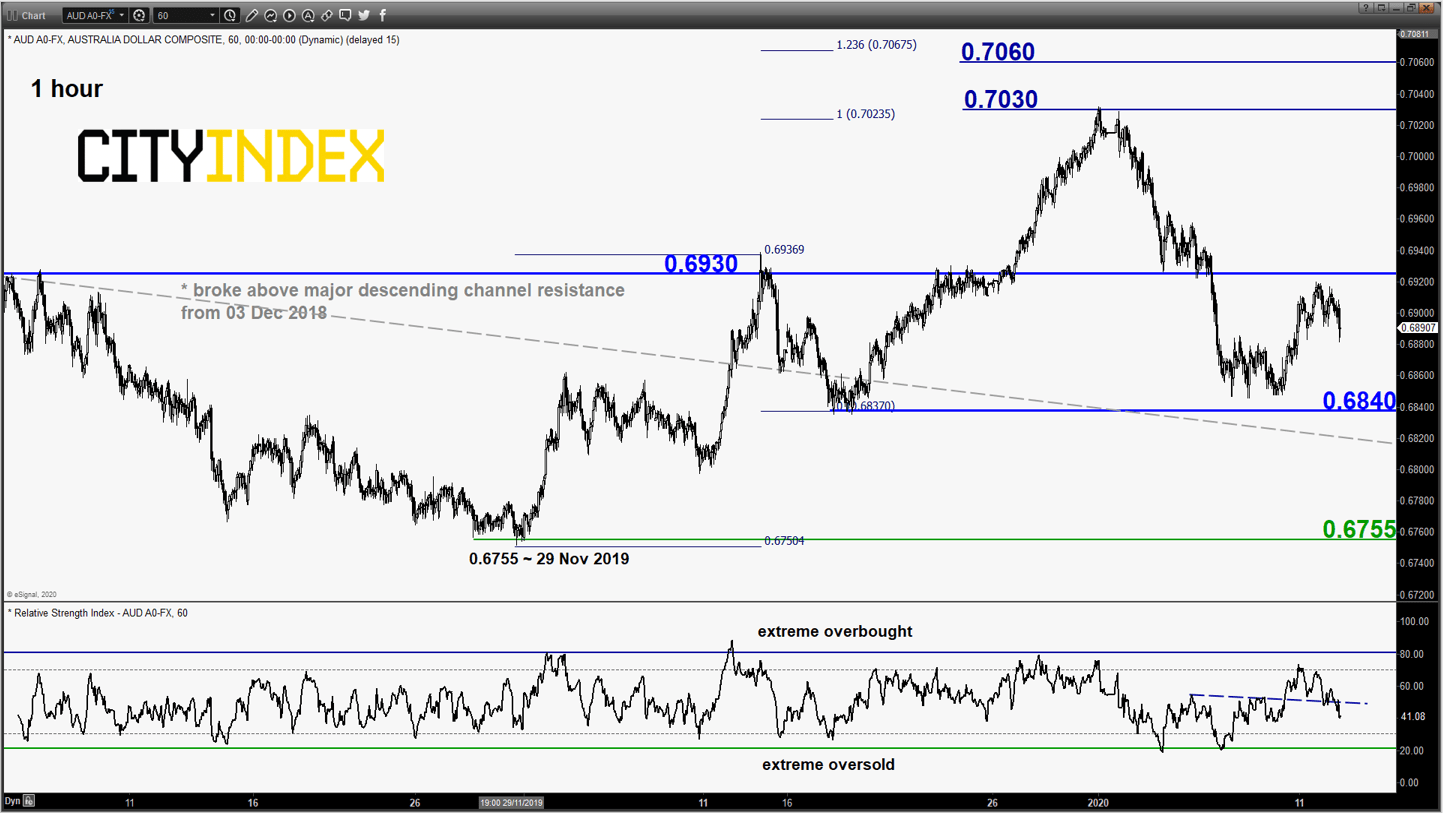
AUD/USD – Mix elements intact
click to enlarge chart
- No change; maintain neutrality stance between 0.6930 and 0.6840 (also the pull-back support of the former major descending channel resistance from 03 Dec 2018 high).
- Only a clearance with an hourly close above 0.6930 revives the bullish tone for push up to retest 0.7030 before targeting 0.7060/7080. On the flipside, a break with an hourly close below 0.6840 sees a further slide to probe the 0.6755 major support (the ascending trendline from 07 Aug 2019 low).
Charts are from eSignal
Latest market news
Today 08:33 AM
Latest EUR articles
March 25, 2024 02:55 AM
January 22, 2024 04:19 AM
January 18, 2024 04:46 AM
August 31, 2023 02:19 AM