


GBP/USD – A potential minor rebound is on the cards
click to enlarge chart
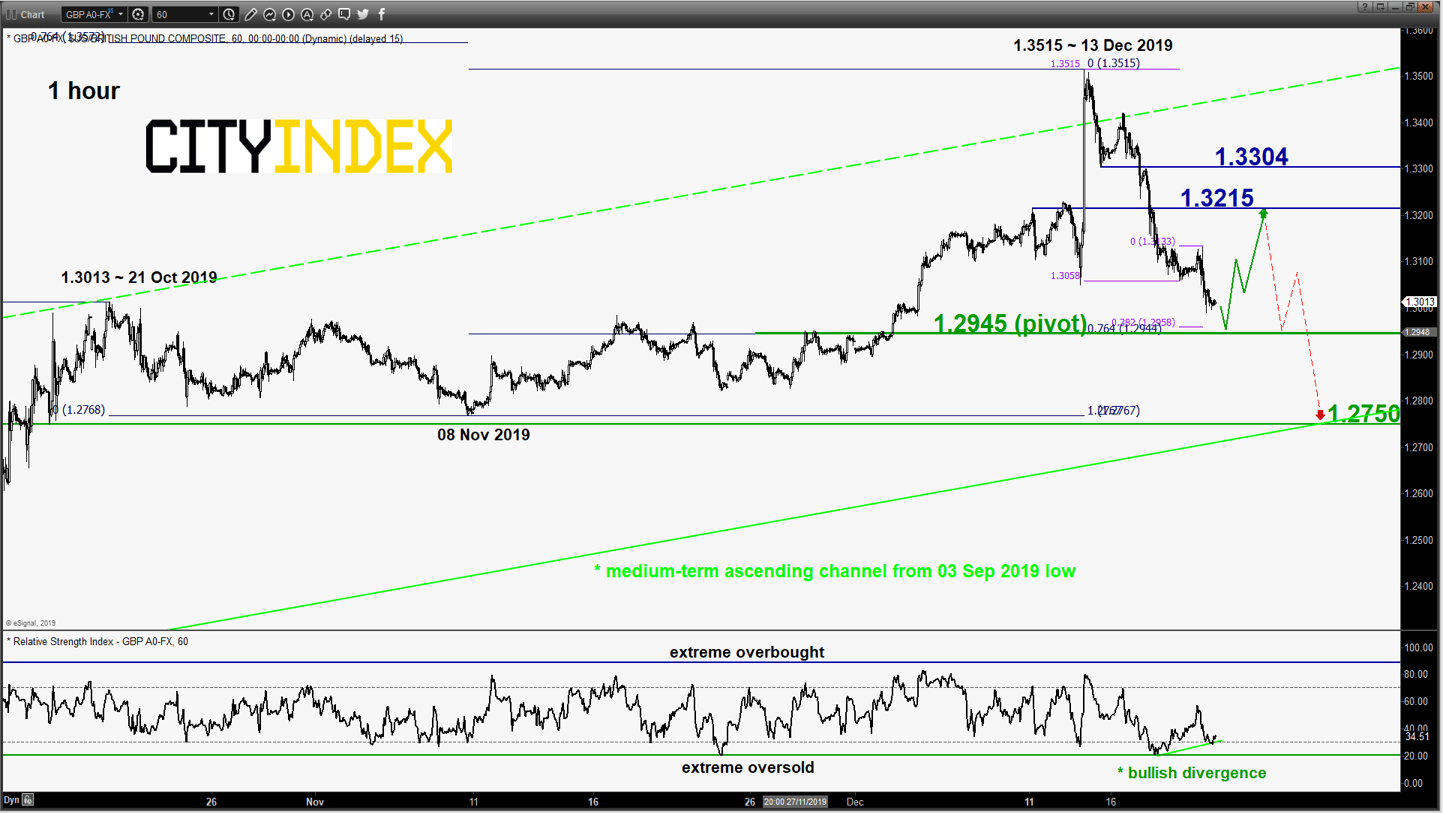
- The pair has staged the expected slide and hit the short-term target/support of 1.3000/2970 as per highlighted in our previous report (click here for a recap).
- Fractal/Elliot Wave analysis suggests a potential minor rebound to retrace the on-going slide from 13 Dec 2019 high of 1.3515 as the price action of the pair is approaching a Fibonacci retracement/expansion cluster at 1.2945.
- In addition, the hourly RSI oscillator has traced out a bullish divergence signal at its oversold region. Flip to a bullish bias with 1.2945 as the short-term pivotal support for a potential minor rebound to target the intermediate resistance at 1.3215 max 1.3300 before another downleg materialises.
- However, an hourly close below 1.2945 invalidates the rebound scenario for a continuation of the slide towards the upper limit of the key medium-term support at 1.2750 (lower boundary of the ascending channel from 03 Sep 2019 low & 50% Fibonacci retracement of the up move from 03 Sep low to 13 Dec 2019 high).
EUR/USD – 1.1200 remains the key resistance to watch
click to enlarge chart
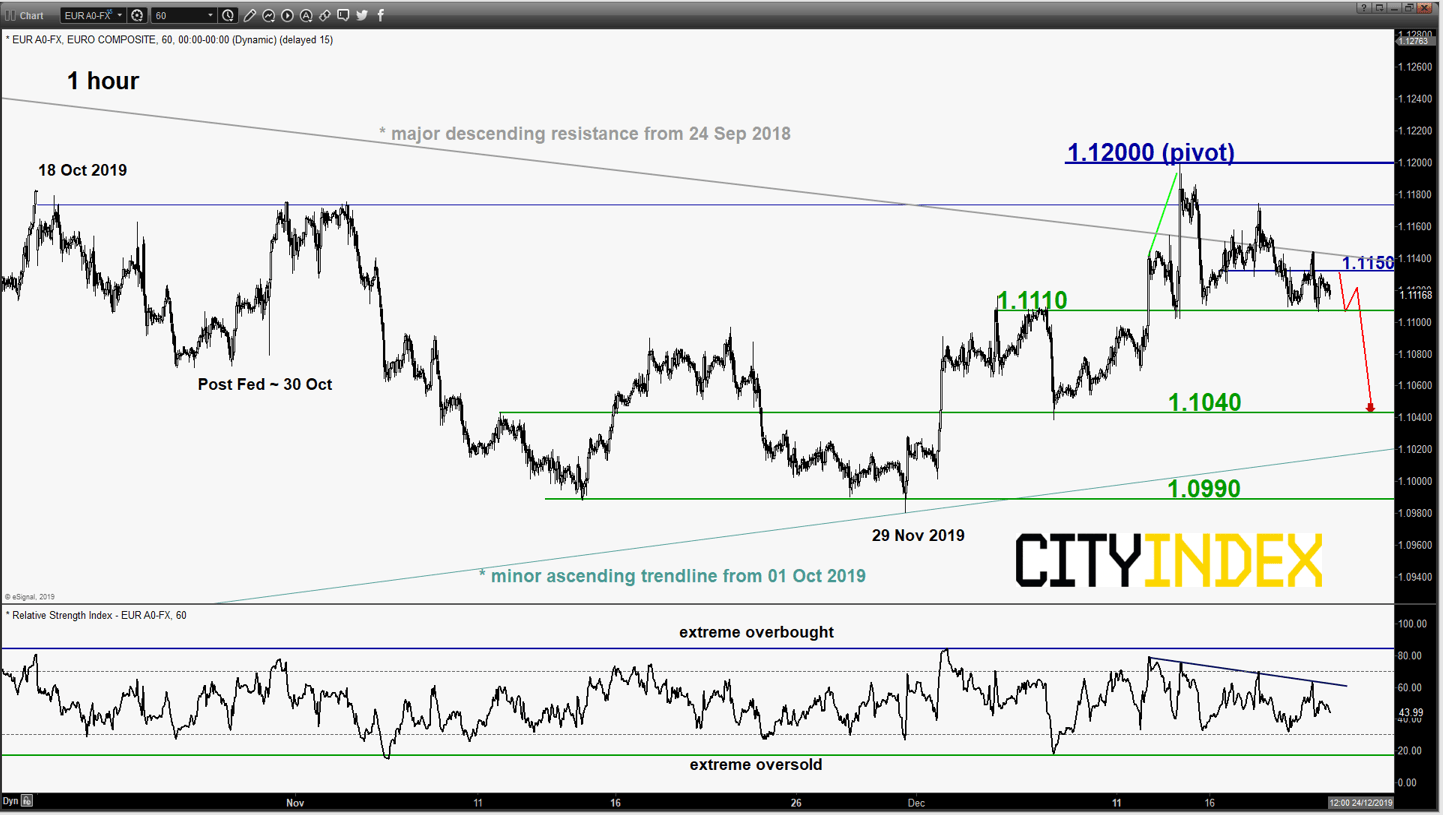
- No major changes on its price action configuration, as the pair hit the first short-term support at 1.1110 and traded sideways thereafter.
- 1.1200 remains the pivotal resistance for a potential push down to test the next near-term support at 1.1040 within a range configuration. However, a daily close above 1.1200 sees a bullish breakout for a further push up towards the next intermediate resistance at 1.1285.
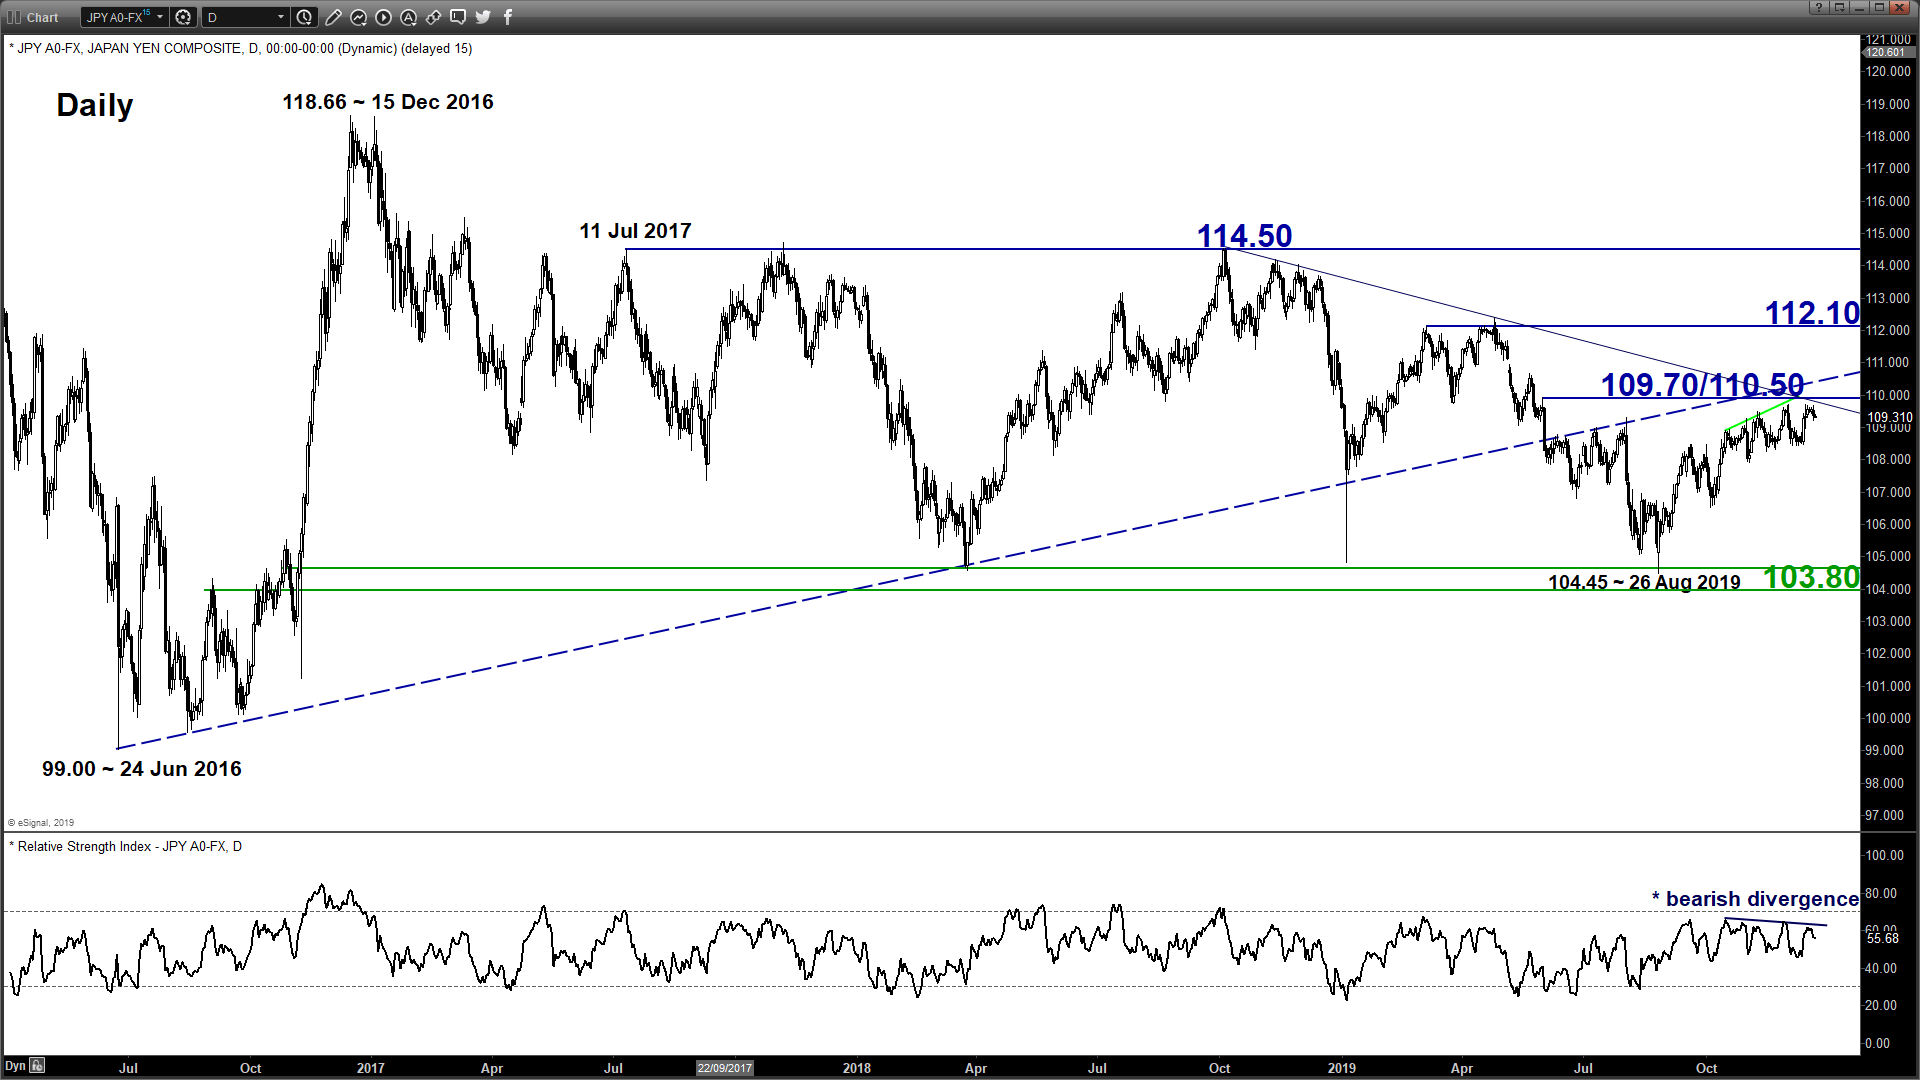
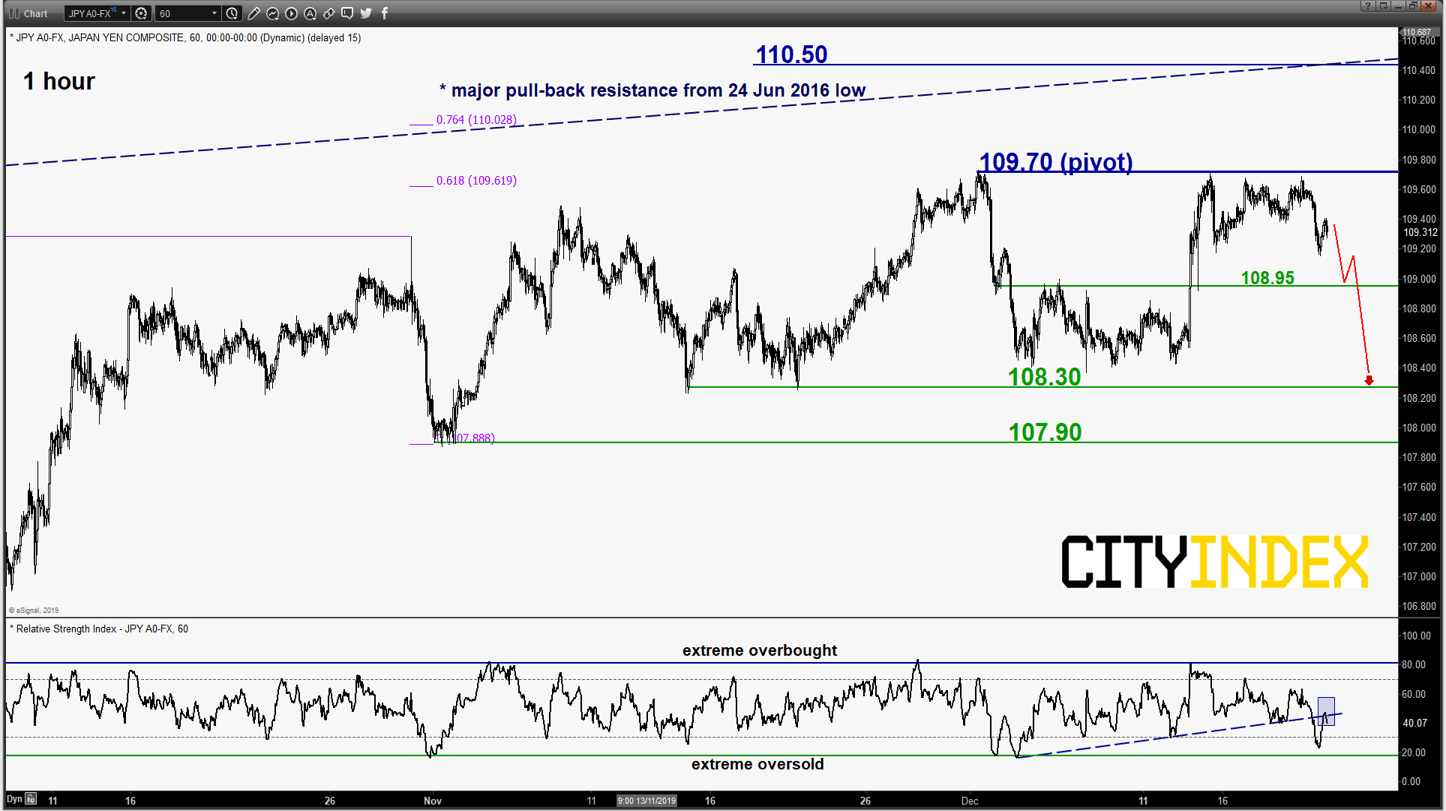
USD/JPY – Bulls are still hesitant as liquidity thins ahead of year end
click to enlarge charts
- No change, 109.70 remains the key short-term pivotal resistance for a potential push down to retest 108.95 and below it sees a further slide towards the minor range support area of 108.30/107.90.
- However, an hourly close above 109.70 negates the bearish tone for a further squeeze up to test the 110.50 major resistance.
AUD/USD – Neutral stance intact
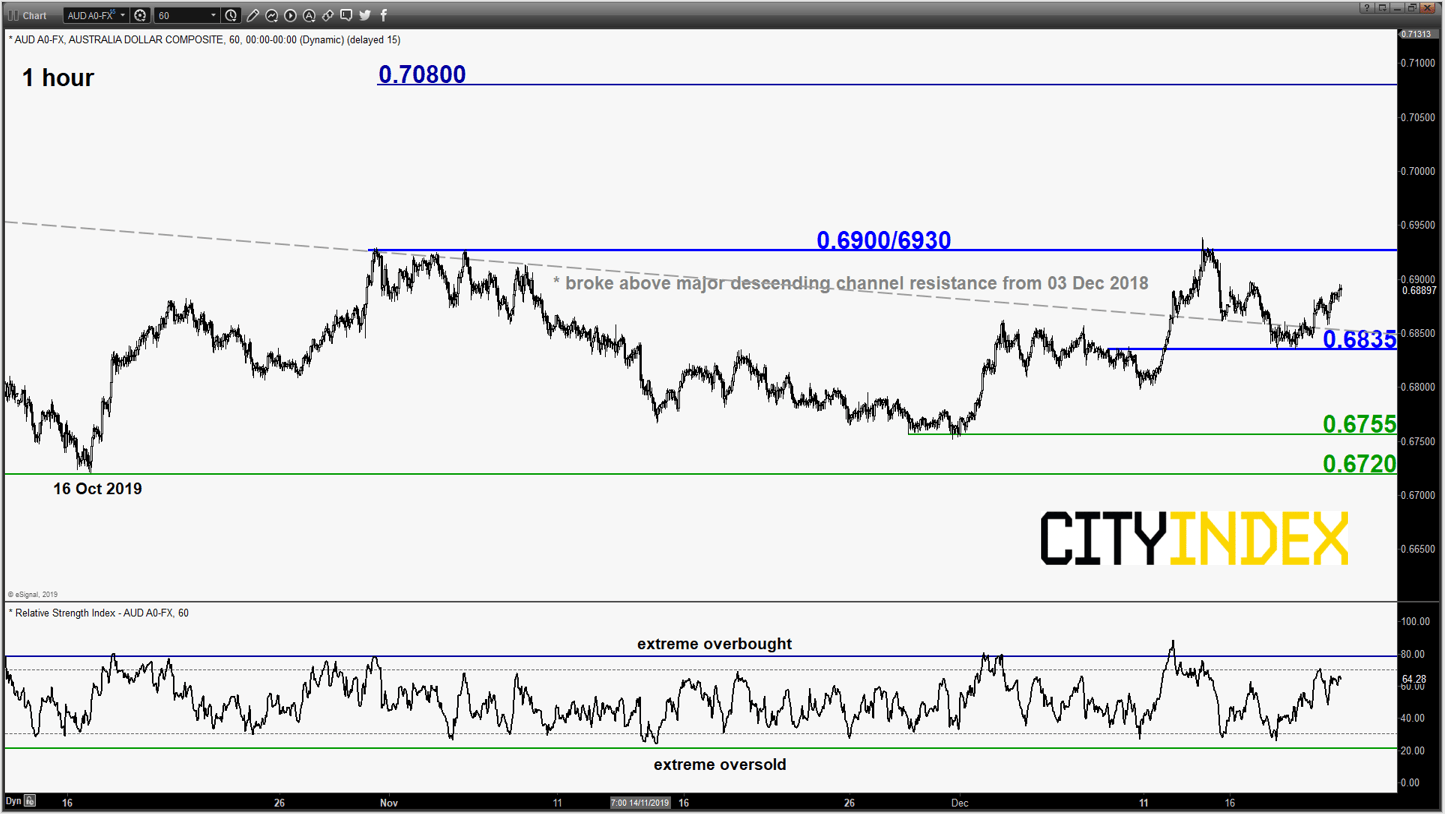
click to enlarge chart
- Continued to trade sideways above the pull-back support of the former major descending channel resistance from 03 Dec 2018 high. Remain neutral between 0.6930 and 0.6860. An hourly close above 0.6930 sees a further push up to target the next resistance at 0.7080 (18 Jul 2019 medium-term swing high).
- On the flipside, a break below 0.6860 invalidates the bullish breakout for a slide back into the range configuration to retest 0.6755/6720 support.
Charts are from eSignal
Latest market news
Yesterday 03:30 PM
Yesterday 01:23 PM
Yesterday 11:00 AM
Yesterday 08:15 AM
Latest EUR articles
April 13, 2024 08:00 PM
March 25, 2024 02:55 AM
January 22, 2024 04:19 AM
January 18, 2024 04:46 AM