


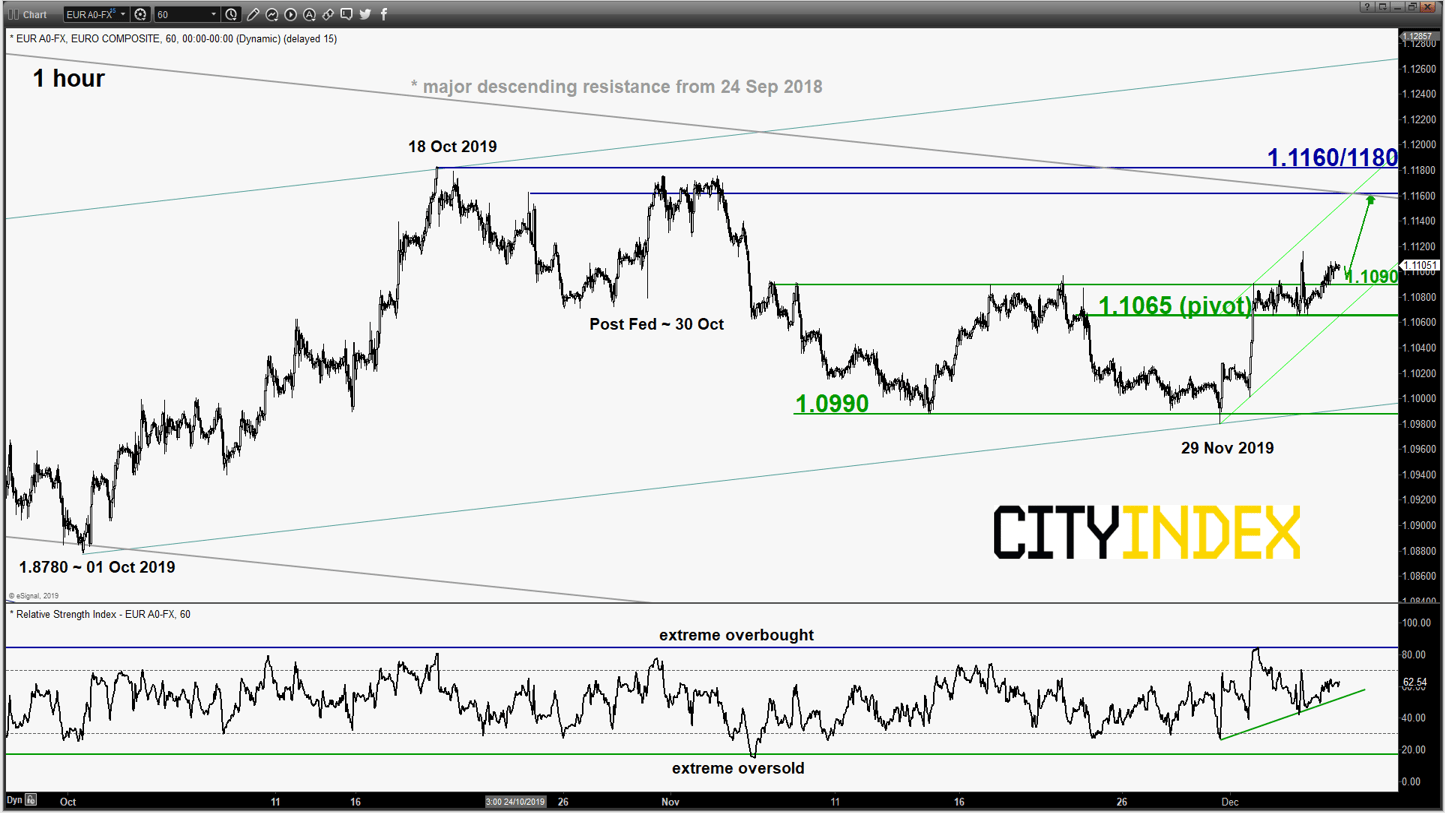
EUR/USD – Potential push up to test major descending resistance
click to enlarge chart
- The pair has staged a break above the 1.1090 upper limit of the short-term neutrality range as per highlighted in our previous report (click here for a recap). Right now, it may continue the push up to test the next resistance 1.1160/1180 (18 Oct 2019 range top & the major descending resistance from 24 Sep 2018) with 1.1065 as the key short-term pivotal support.
- However, a break with an hourly close below 1.1065 sees a slide back towards the minor range support of 1.0990.
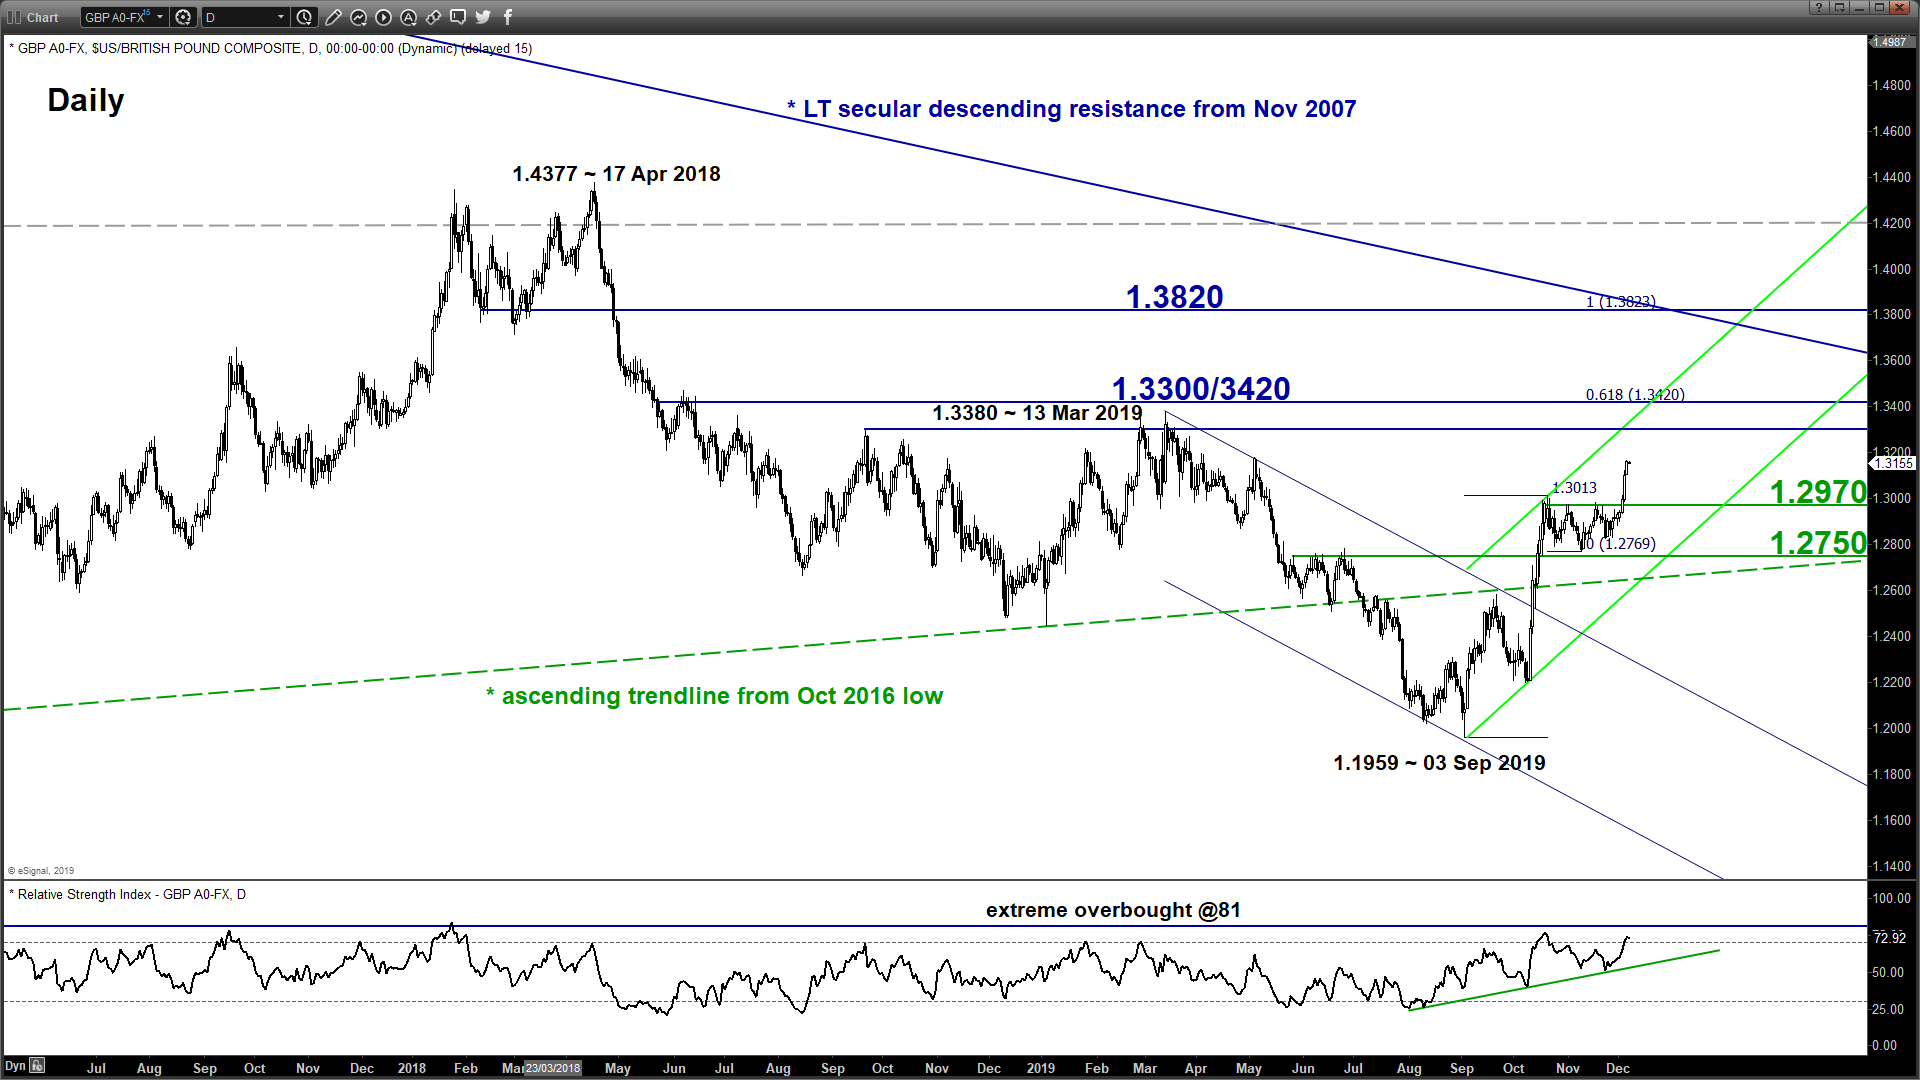
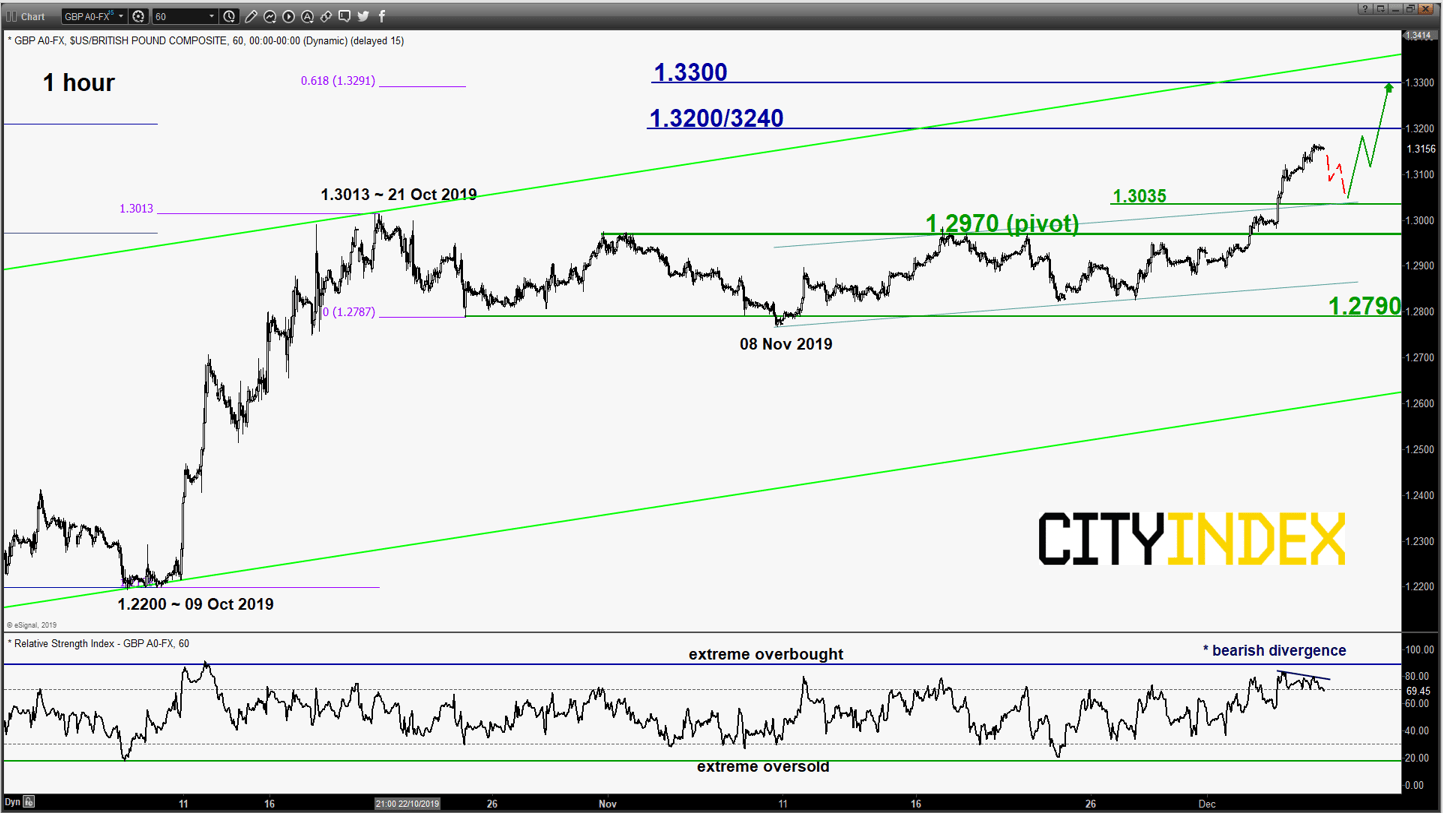
GBP/USD – Bullish breakout but risk of a minor pull-back imminent
click to enlarge charts
- The pair has staged a bullish breakout above the 1.2970 range resistance and rallied by 190 pips in the last 3 days. In the medium-term, the impulsive up move sequence of the uptrend phase from 03 Sep 2019 low of 1.1959 has resumed.
- In the shorter-term, the hourly RSI oscillator has traced out a bearish divergence signal at overbought region which indicates that the on-going rally has reached at “overstretched” state where it may stage a pull-back.
- Flip to a bullish bias in any pull-back with 1.2970 as the key short-term pivotal support for another potential upleg to target the next resistances at 1.3200/3240 and 1.3300 next. However, an hourly close below 1.2970 negates the bullish tone for a deeper pull-back towards the next support at 1.2970/2950.
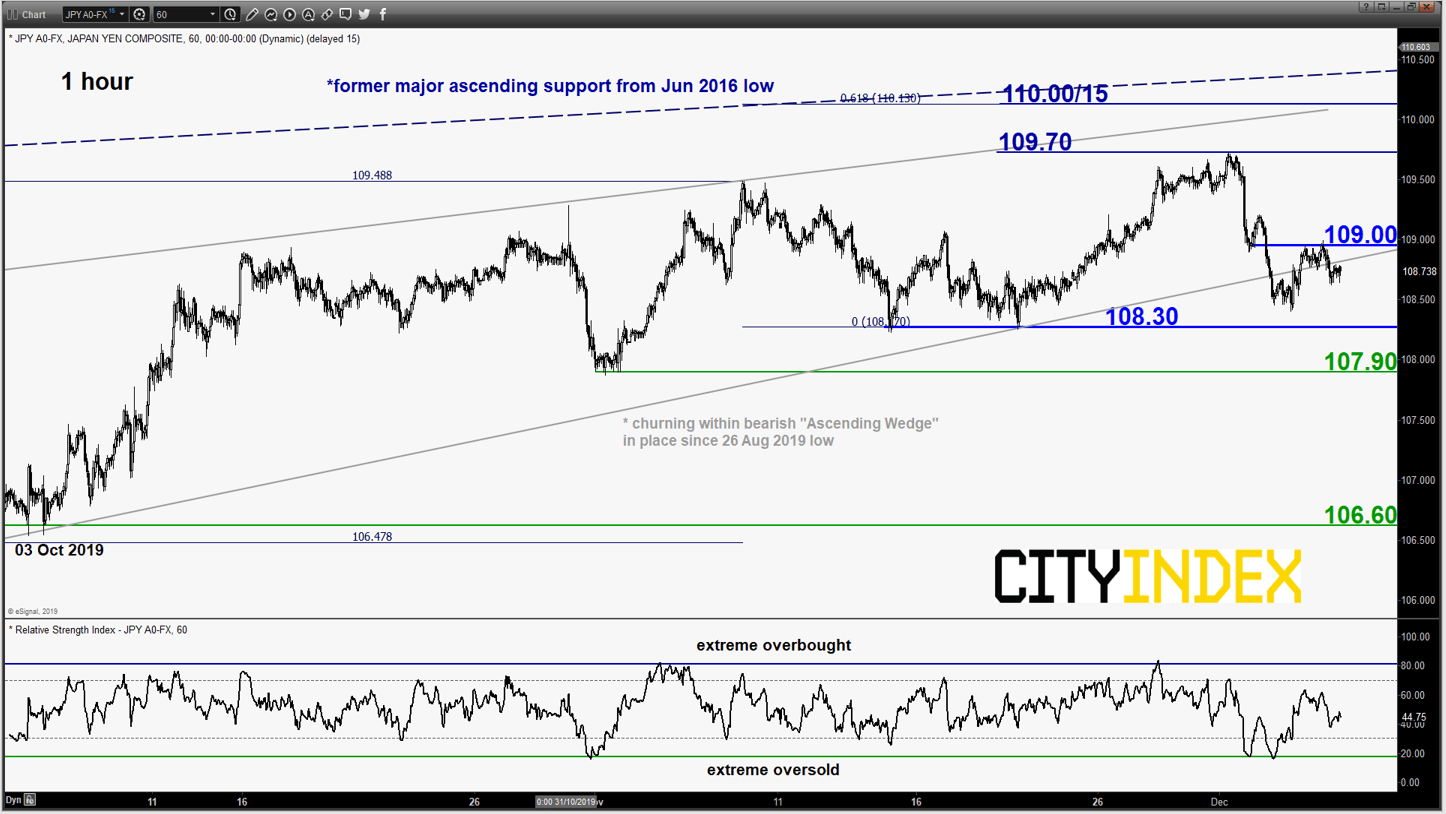
USD/JPY – Gyrating at the Ascending Wedge support
click to enlarge chart
- The pair has whipsawed around the bearish “Ascending Wedge” support and conflicting U.S-China trade related news flow has made matter worse as we approach a “less liquid/thinly traded environment” towards the last 3 weeks of 2019.
- The conviction for a final push up towards the “Ascending Wedge” top/resistance at 110.00/15 as been reduced at this junction. Therefore, we prefer to turn neutral now between 109.00 and 108.30. Bears need to have an hourly close below 108.30 for a “clean break down” to target the next supports at 107.90 and 106.60 next.
- On the flipside, a clearance with an hourly close above 109.00 allows the short-term bulls to be in control for a push up towards 109.70 and 110.00/15 next.
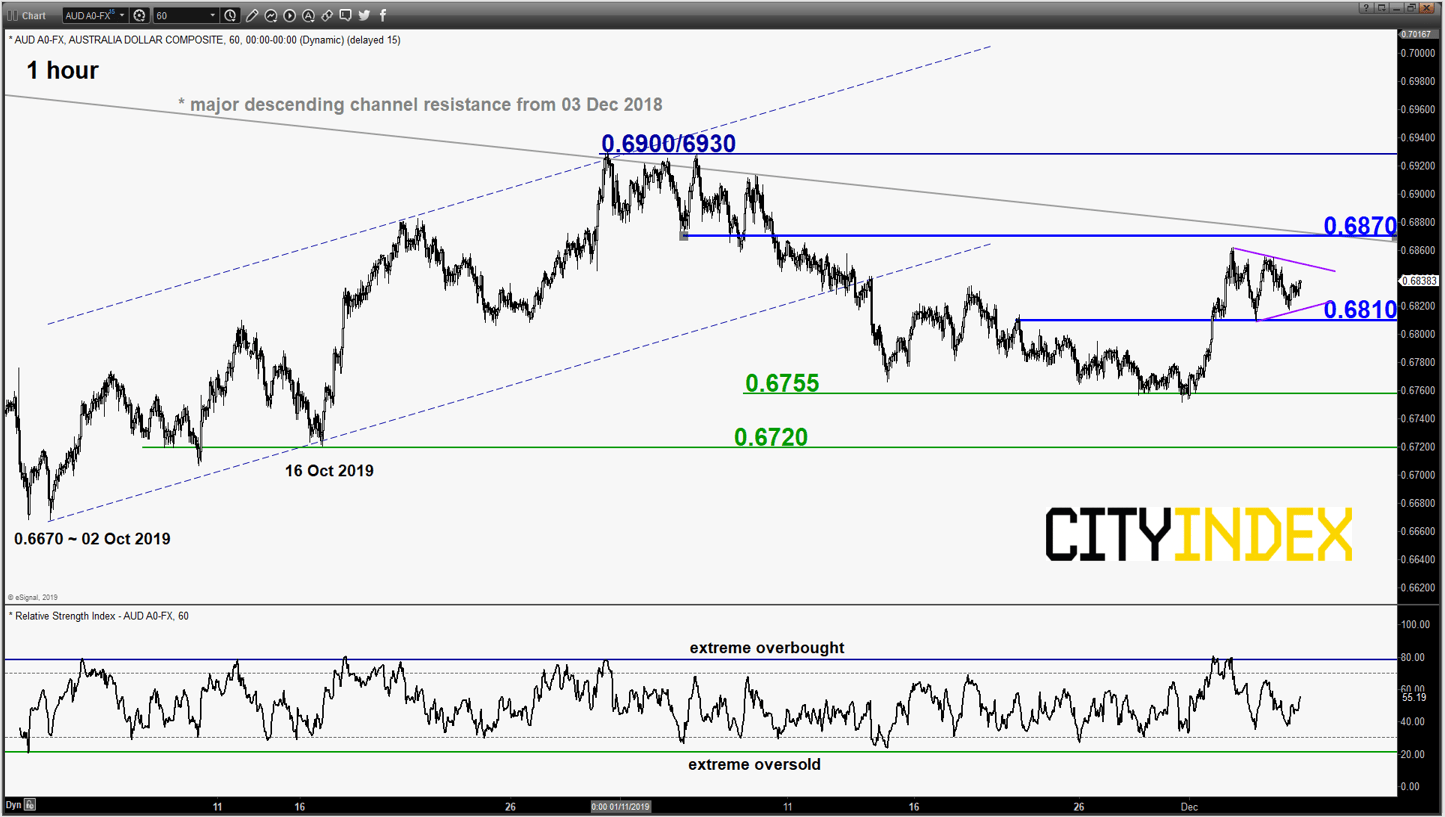
AUD/USD – Sideways below major descending channel resistance for now
click to enlarge chart
- After the recent RBA monetary policy meeting on 03 Dec, the pair has been trapped within a minor “Symmetrical Triangle” range configuration below the 0.6845 major descending channel resistance from 03 Dec 2018 high.
- Prefer to turn neutral now between 0.6870 (also the 61.8% Fibonacci retracement of the recent slide from 31 Oct high to 29 Nov 2019 low) and 0.6810. An hourly close below 0.6810 revives the short-term bearish tone for a slide to retest 0.6755 and even 0.6720 next.
- On the flipside, a clearance with a daily close above 0.6870 validates a major bullish breakout for an assault towards 0.6900/6930 in the first step.
Charts are from eSignal
Latest market news
Yesterday 08:33 AM
Latest EUR articles
April 13, 2024 08:00 PM
March 25, 2024 02:55 AM
January 22, 2024 04:19 AM
January 18, 2024 04:46 AM