


May 11, 2020 11:12 AM
Currency Pair of the Week: NZD/USD
The Reserve Bank of New Zealand (RBNZ) is set to meet on Wednesday to discuss interest rate policy. Although no change is expected, the focus will be whether or not they increase the size of their QE, and my how much. At the last meeting in March, there was talk they could double the size of QE to NZD 60 billion at this meeting. In addition, market participants will be watching the press conference to see if there is talk about the possibility to moving to negative interest rates. If the RBNZ continues with a dovish tone, the New Zealand Dollar could move lower.
On Tuesday, the US releases Inflation data. The headline inflation rate is expected to fall from -0.4% to -0.7%. The Core inflation rate is expected to fall to -0.2% from -0.1%. There has been speculation among economists and traders lately that the Fed may go to negative interest rates, something they don’t want to do. On Tuesday there are no less then 5 Fed members speaking throughout the day. In addition, Fed Chairman Powell is set to speak on Wednesday to the Peterson Institute for International Economics regarding the current US economy. It will be important to watch for any comments regarding negative rates.
The daily timeframe chart for NZD/USD is showing that price is currently in an ascending wedge formation. Traders will look for a break lower to confirm the wedge. The target for an ascending wedge is a full 100% retracement, which would put price below .5700. In addition to the ascending wedge, the pair opened the week just below horizontal resistance at .6193 and has been hovering near the 50% retracement level form the highs of December 31st, 2019 to the lows of March 19th, near .6110. Although there is still lots of time left in the day, NZD/USD is in the process of forming a bearish engulfing candle, which would point lower for the pair.
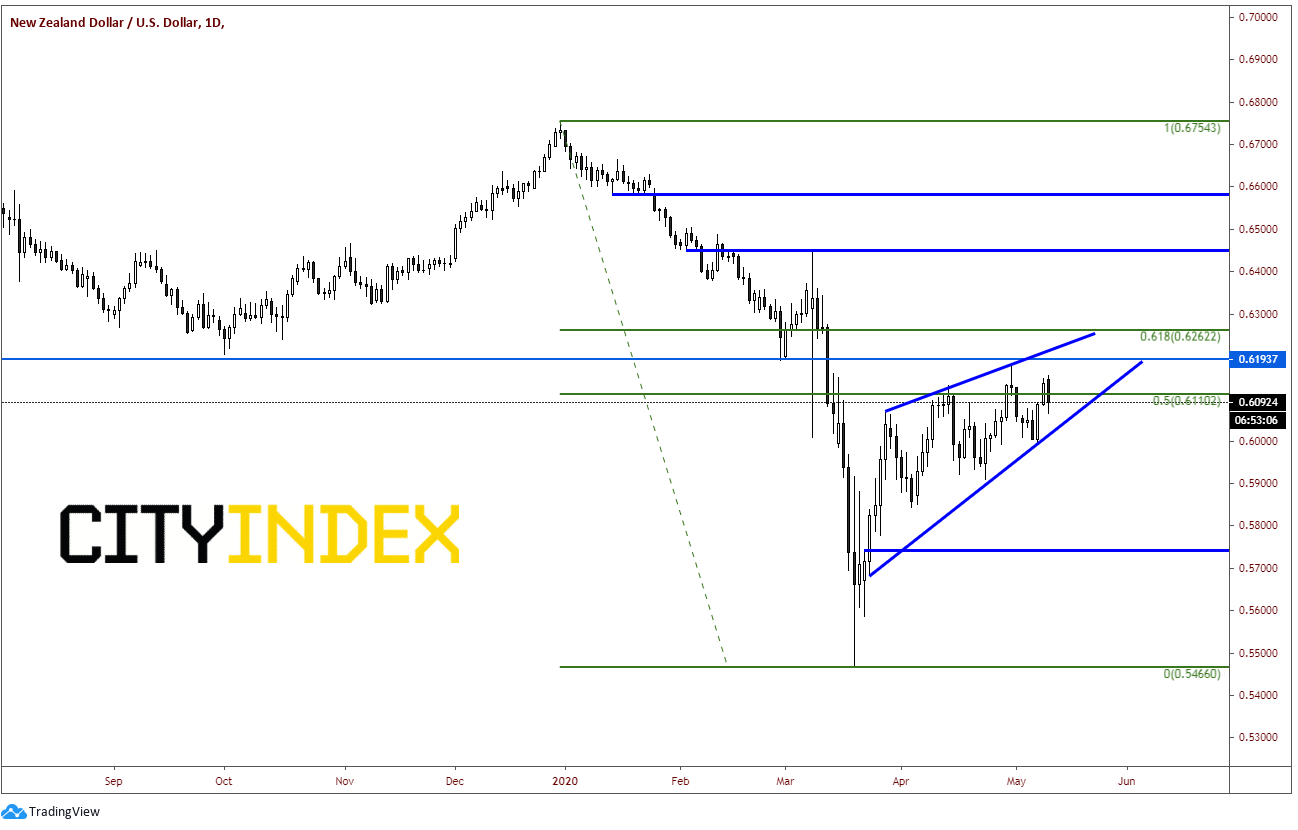
Source: Tradingview, City Index
Resistance above at the previously mentioned horizontal resistance level of .6193. Next level is the 61.8% Fibonacci retracement level and the upper trendline of the ascending wedge near.6260. Above there, price can run up to the March 9th highs near .6450. First support is at the bottom trendline of the ascending wedge near .6050. Below there, NZD/USD can fall all the way down to horizontal support near .5740. Final support is March 19th low at .5470.
NZD/USD traders will have all eyes on their respective central banks this week. The more dovish central bank will win the battle for a depreciation of their currency. However, the technical picture is showing a corrective formation, which indicates that the pair may be ready for a move lower!
Latest market news
Today 11:14 AM
Today 08:28 AM
Yesterday 03:30 PM
Latest NZD articles
April 16, 2024 11:23 PM
April 16, 2024 06:11 AM
April 9, 2024 01:41 AM
February 13, 2024 04:43 AM