Crude volatility here to stay as traders eye OPEC
Last week was a volatile one for crude oil. Brent and WTI prices rose in the first three days of the week but then gave […]
Last week was a volatile one for crude oil. Brent and WTI prices rose in the first three days of the week but then gave […]
Last week was a volatile one for crude oil. Brent and WTI prices rose in the first three days of the week but then gave back much of those gains in the last two. Nevertheless both contracts managed to eke out gains for the week and it was the first positive week in four for Brent. And following a weaker start this morning, oil prices have turned slightly higher. The volatility therefore continues as Friday’s OPEC meeting nears. The pressure is growing on Saudi Arabia to cut production after it convinced the cartel to keep oil output high in order to maintain market share and presumably squeeze shale and other weaker producers out of the market. That strategy has so far failed to work effectively with rivals proving to be surprisingly resilient and shale output has fallen only slightly. Meanwhile oil prices have dropped far more, and remained depressed longer, than what the Saudis and indeed many other oil producers had envisaged last year. Saudi’s oil minister last week appeared as if he had changed his tone slightly and this has led to some speculation that the OPEC’s largest player may rethink its strategy. However it is unlikely that a production cut will be agreed upon as Saudi and a few other OPEC members can still survive at current oil prices for a lot longer than some of their rivals. So although prices being this low may be uncomfortable for the OPEC for now, it may still pay off in the long term as soon or later some of the weaker non-OPEC producers will be forced out of the market. With rig counts continuing to drop, it could be only a matter of time before the rebalancing process begins to accelerate and the market tightens.
But in the near-term and in light of the still-oversupplied oil market, any price gains are likely to be short-lived, especially since Iran is most likely to increase its crude output as more sanctions are lifted. Oil speculators will also be reminded about the demand aspects of oil this week, for we have a large number of global macroeconomic pointers to look forward to, starting with the Chinese manufacturing PMIs on Tuesday. If they point to further deterioration in industrial demand from the world’s second largest consumer of oil then this won’t be good news for crude prices. However if the PMIs show a surprise expansion then we may see some further short-covering rally in oil.
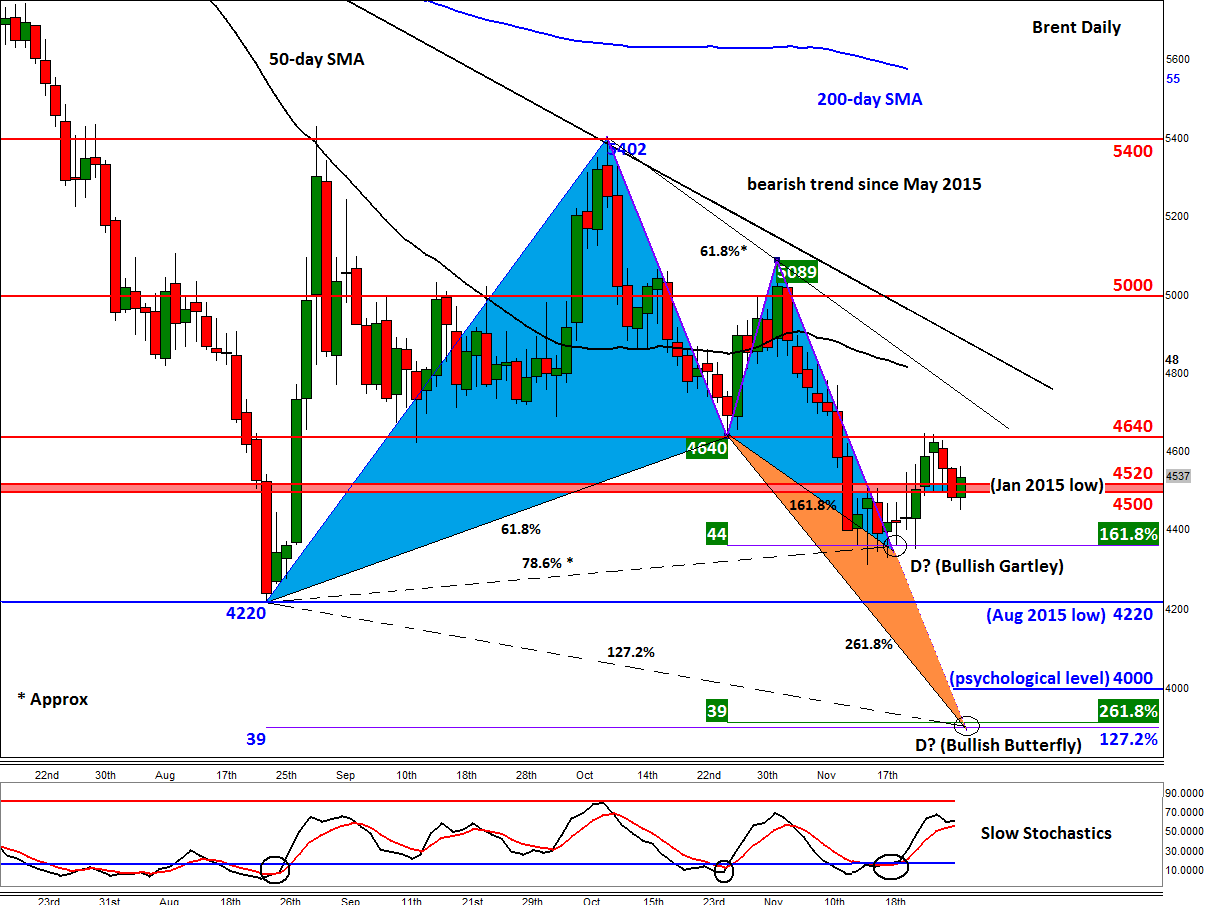
Brent crude was trading above the $45 a barrel mark at the time of this writing. It was thus continuing to hold above the key $43.50 – $44.00 area. This is where a Bullish Gartley pattern resides, which can sometimes pinpoint major lows in the markets. As this pattern is holding so far, there is still the possibility we may have seen the bottom in oil. Although Brent has taken out important resistance around the $45.00-$45.20 region, it has failed to break the more important $46.40 handle which was previously support. If this level now breaks then we may see a more aggressive rally, at least towards the bearish trend and the 50-day moving average, around $48.00 next.
But if Brent fails once again at these levels and eventually falls below the abovementioned Bullish Gartley support, then the next logical target for the bears would be the August low around $42.20. Thereafter a more significant Bullish Butterfly pattern comes in around $39. This formation is the same as the Gartley in that it is constructed by Fibonacci levels, but the point D comes in below the 100% retracement of XA, in this case at the 127.2% extension level. The CD leg is also extended – in this case, by 161.8 per cent times AB. The area around $39 is also where the 261.8% of the BC move resides, thus making it an exhaustion point. But will oil even get to $39 and even if it does, will it necessarily form a major base there? We could simply see a short-term bounce, before the trend resumes and oil prices fall further. So treat all these Gartley/Butterfly and indeed any other technical patterns with caution, especially when going against the underlying trend.