Crude stages short covering bounce
Crude prices have bounced sharply off their lows after both contracts fell to their lowest levels since December 2008 earlier this morning. The bounce looks […]
Crude prices have bounced sharply off their lows after both contracts fell to their lowest levels since December 2008 earlier this morning. The bounce looks […]
Crude prices have bounced sharply off their lows after both contracts fell to their lowest levels since December 2008 earlier this morning. The bounce looks to be driven first and foremost by profit-taking given that prices were severely oversold anyway and as WTI reached a key support level near $34.50 (see below for technical details). In addition, $35 a barrel has been on the back of many traders’ minds, so it is hardly surprising that it has found support around this level. Apart from short-covering, it is also possible oil has been supported by opportunistic buying. In any case, the potential gains are likely to be short-lived, given that nothing has changed fundamentally. The oil market remains severely oversupplied and according to the International Energy Agency, the excess won’t be removed until the end of next year. Potential increases in Iranian oil production in 2016 and the resilient US shale production means the surplus will be even harder to eliminate. The EIA also envisages that global oil demand growth will slow to 1.2 million barrels a day in 2016, from 1.8m bpd this year. Longer-term investors may be put off crude because of the potential impact on fossil fuel demand after the historic climate deal was signed in Paris at the weekend, which turns the world’s focus on producing renewable, green energy. That being said, this is unlikely to have major implications on oil prices in the short-term. It is also possible that if we haven’t already reached it, we may be very close to a bottom for oil. So, we are unlikely to see further sharp decline in oil unless prices stage a recovery first.
Technical outlook: WTI
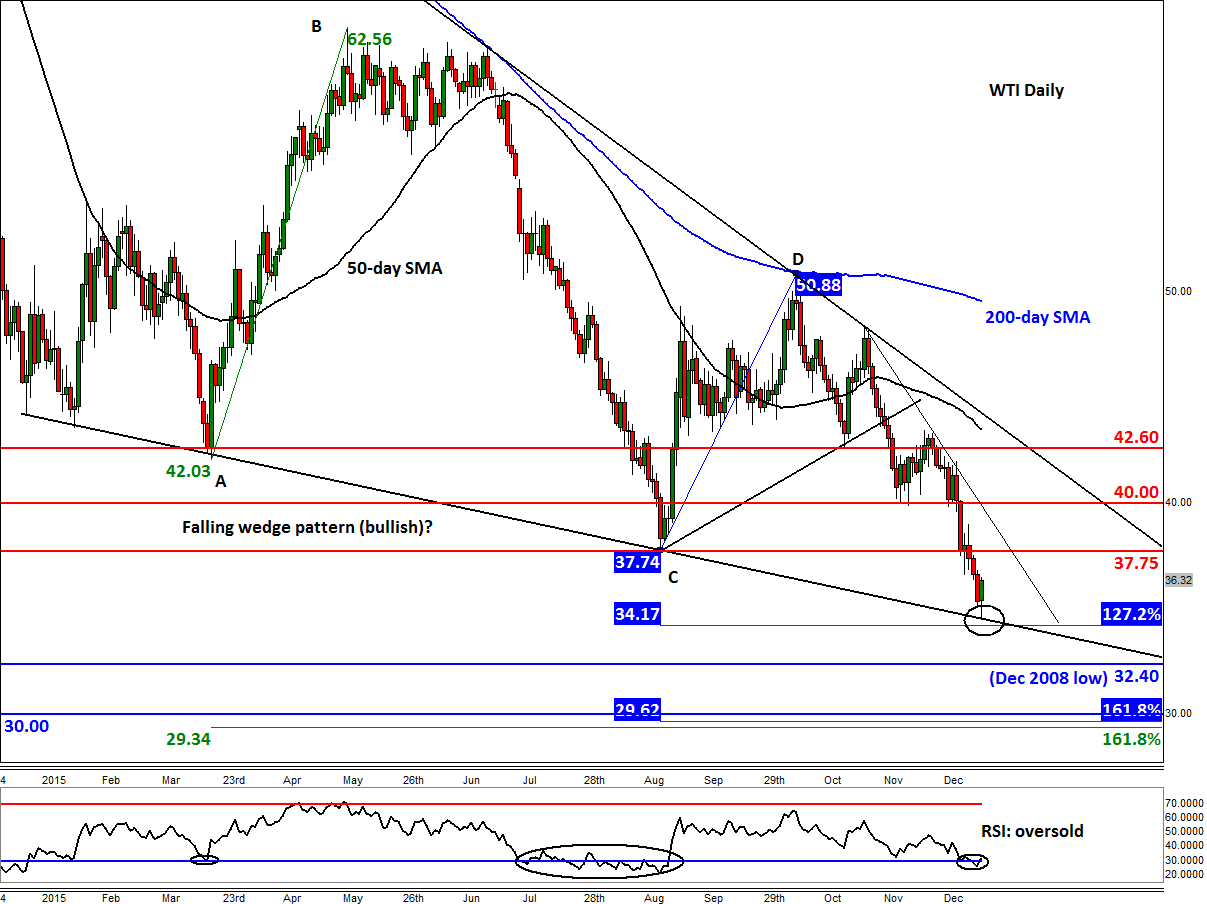
We have had a couple of converging trend lines on our WTI charts for some time now. Today, US oil finally dropped to test the lower trend at $34.50. Like the previous four occasions, oil has once again found strong support from this trend line. Although it is too early to call this a bottom, the worst of the selling pressure may now be behind us. But a bounce was long overdue anyway, given that prices were severely oversold after several consecutive down days. The converging trend lines mean we have a possible falling wedge formation in the making, which is supposed to be a bullish pattern. However for this to actually become valid, we will need WTI to break through the resistance trend at some stage. Until and unless that happens, one should treat this bounce with a pinch of salt and therefore proceed with extra caution as this could turn out to be a dead-cat bounce in a downward-trending market.
Some of the near-term resistance levels are shown on the chart; these include $37.75 and $40.00, levels which were previously support. On the downside, the next potential bearish target below today’s low and the support trend line at $34.50 could be the December 2008 low at $32.40. Thereafter is the psychologically-important $30 handle, which comes in less than a buck above the 161.8% Fibonacci extension levels of the previous corrective swings at $29.35 and $29.60, respectively.