Crude slumps as fears intensify over US supply surplus
After a significant drop last week, oil prices tried to stabilise themselves at the start of this week as both contracts ended Monday’s session slightly […]
After a significant drop last week, oil prices tried to stabilise themselves at the start of this week as both contracts ended Monday’s session slightly […]
After a significant drop last week, oil prices tried to stabilise themselves at the start of this week as both contracts ended Monday’s session slightly higher. Among other things, short-covering was the reason behind the slightly firmer oil prices then. Brent and WTI started Tuesday’s session on the front foot. However, they turned lower again by mid-morning before going into a mini free fall by midday. The latest drop was apparently in response to the OPEC’s monthly oil report. While the OPEC acknowledged that compliance with the supply adjustments by OPEC and some non-OPEC producers supported prices and it raised its global oil demand forecast for 2017, it also raised its estimates for oil production from outside of the cartel. In the US, shale producers have ramped up drilling activity and increased oil output in response to higher prices. This has put serious question marks over the OPEC’s attempts to balance the oil market.
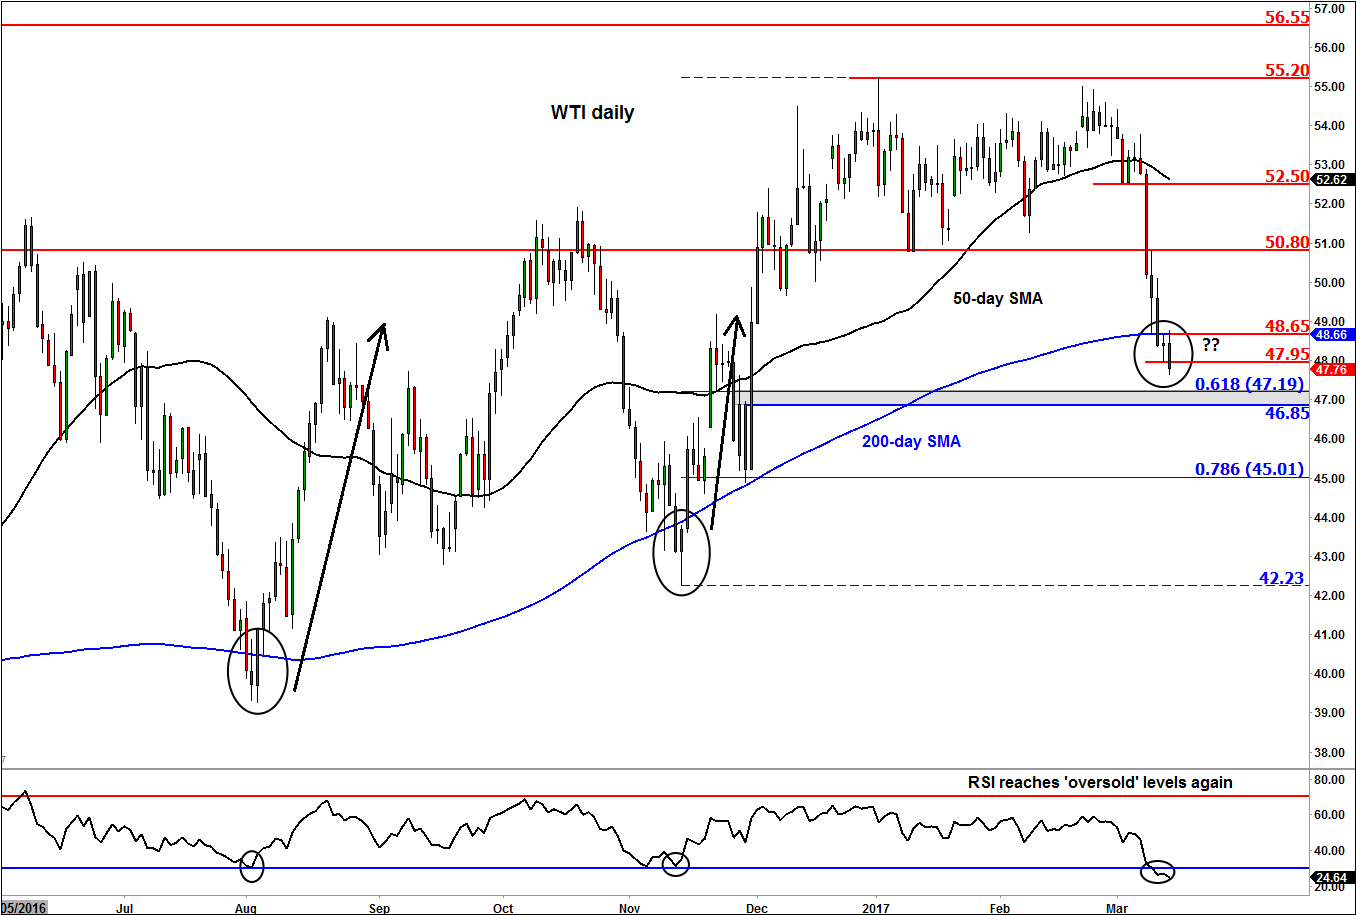
As a result of the recent sharp falls, WTI oil is finding itself below the technically-important 200-day moving average again. While this is normally a bearish indication, crude oil has a tendency to trap momentum-chasing traders before moving in the opposite direction. Indeed, the last couple of times that WTI moved below the 200-day moving average, in August and November, it bounced back very strongly. On both occasions, the Relative Strength Index (RSI) momentum indicator had moved to around the 30 level, which is deemed by many as the ‘oversold’ threshold. WTI is finding itself in pretty much the same situation now. Thus, if recent history is anything to go by, we may see oil prices rise from here. So far however we haven’t seen any distinct bullish indications, but we are anticipating it.
For WTI to turn bullish it will need to break above some resistance levels now. Monday’s high at $48.65, for example, is such a level since it is located above the 200-day moving average. If oil were to get there, it may trigger a short-covering response from the bearish camp. That being said, the buyers would do very well to push the price of WTI back towards the old key support level of $50.80, which may turn into resistance upon re-test. Further resistance is seen at $52.50, the last support level pre breakdown.
For now though, the path of least resistance remains to the downside. If WTI continues to hold below Monday’s low at $47.95 then the next bearish objective would be at $47.20, the 61.8% Fibonacci retracement level.