Crude set to end volatile week in the black
The price of oil has been trading sideways all week this week, alternating between up and down days in each session. At the time of […]
The price of oil has been trading sideways all week this week, alternating between up and down days in each session. At the time of […]
The price of oil has been trading sideways all week this week, alternating between up and down days in each session. At the time of this writing on Friday afternoon, oil prices are higher and barring a last minute sell-off – say in reaction to the rig count data due to be published by Baker Hughes later on today – they will finish the week in the positive territory.
Clearly, there has been no real conviction from either the buyers or the sellers this week. And who could blame them? After all, there seems to be no consistency in oil data and forecasts from top oil agencies. What’s more, the negative impact of a stronger dollar on the buck-denominated commodity has been offset by the rallying equity markets, which from time to time has boosted the appeal of risky assets across the board, including crude oil and copper. Added to all this, long-term financial speculators seem to have booked profit as net long positions were trimmed further in the week to 5 July, as indicated by the CFTC and ICE’s latest positioning data. But these same speculators may have used this week’s selling as an opportunity to reload their long positions. We will find out if this was the case when the CFTC publishes its latest data after the markets close.
Bullish speculators have also been disheartened by signs US oil production may start to rise again, although the falling crude inventory levels has kept their hopes alive that WTI oil prices may still climb north of $50 in the coming months. Contrary to the API, the official EIA crude stockpiles report in midweek showed inventories fell by a good 2.5 million barrels last week. But oil prices fell nevertheless as this headline number was overshadowed by large builds in stocks of oil products: gasoline inventories rose by 1.2 million barrels while distillate stockpiles – not that they matter much for this time for the year – jumped by 4.1 million barrels last week, the biggest rise in six months. Added to this, there was a 0.6% surge in oil production, which was the most profound increase since October 2015. But to put this into perspective, the rise followed the biggest fall since September 2013 in the week prior, of 2.25%.
But macro numbers from China and the US, the world’s largest economies and biggest consumers of oil, have been improving in recent months and if the trend continues in the coming weeks then this should help to boost oil’s demand prospects. On Friday, we saw China’s GDP (6.7%), industrial production (+6.2%) and retail sales (10.6%) all come in stronger than expected. In the US, inflation data was in line with the expectations (CPI +0.2% m/m) but retail sales, (+0.6% m/m) and industrial production (+0.6% m/m) both topped forecasts.
So there is lots of conflicting macro pointers and while confusion remains high and no major clear catalyst in place, oil prices are likely to trade in large ranges. As such, there should be plenty of decent opportunities for both the buyers and the sellers as long as they remain patient and trade around their key support and resistance levels. Overall, however, I still think oil prices are more likely to head significantly higher than significantly lower from current levels in the next several months as the market is likely to tighten further.
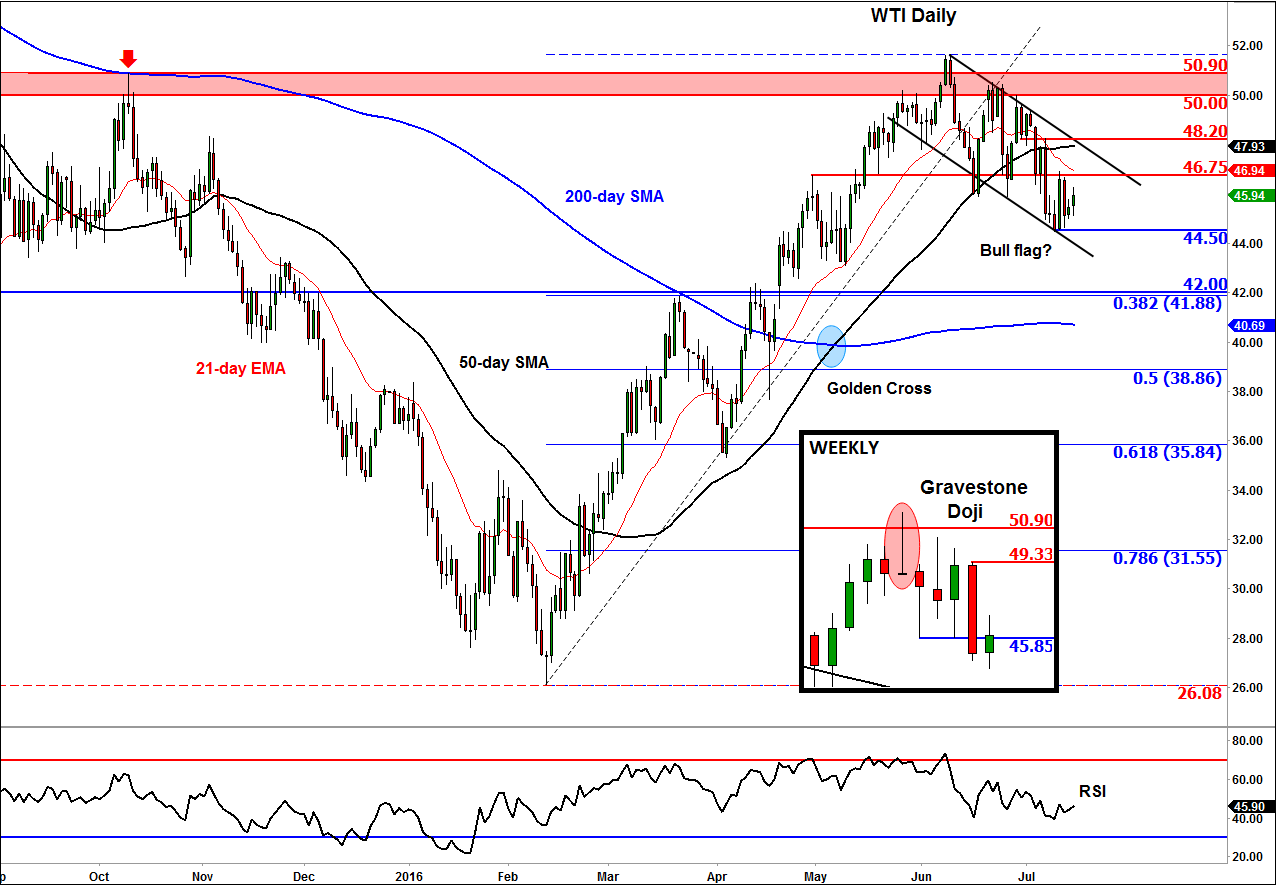
But for now, WTI is stuck inside what looks to be a short-term downward-sloping channel (bearish pattern), which could however turn out to be a long-term bull flag (bullish pattern) if there is a bullish breakout soon. So while oil prices could drop more in the short-term, do look out for a potential breakout which could then pave the way for larger gains in the slightly longer term outlook. In the short-term, the bulls will need WTI to climb back above the $46.75 resistance if it were to have any chance of rising towards the top of its channel again in due course. Otherwise, US oil may go for at least a re-test of the support trend of the bullish flag/bearish channel at $44.50 or lower. The long-term key support sits around $42.00, which is also the 38.2% Fibonacci retracement against this year’s low.