Crude s long term outlook remains bullish
Overnight saw crude oil extend its decline as concerns about oversupply were reinforced although prices have since rebounded ahead of the publication of the official […]
Overnight saw crude oil extend its decline as concerns about oversupply were reinforced although prices have since rebounded ahead of the publication of the official […]
Overnight saw crude oil extend its decline as concerns about oversupply were reinforced although prices have since rebounded ahead of the publication of the official weekly US crude inventories report later this afternoon. In its monthly report, the US Energy Information Admiration (EIA) revised upwards its estimate for US oil production because of the increased drilling activity that we have witnessed over the past several weeks. On top of this, the American Petroleum Institute (API), an industry group, reported a sharper-than-expected 2.1 million barrel rise in US weekly crude stockpiles. As a result, hopes that the official data from the EIA would reveal a 1.3 million decrease – the first decline in two weeks – were dashed.
Nevertheless, the API data also revealed sharp falls in stocks of oil products, especially gasoline (3.9 million barrels), which, if confirmed by the EIA, would imply strong demand. And while US oil production may well increase again later this year, the recent renewed weakness in oil prices means this outcome is now probably priced in. But if oil prices were to remain around their current levels, I would be very surprised to see a marked increase in production. In any case, many oil forecasters, including the EIA, expect the crude market to be undersupplied in the second half of next year. This argues against another significant drop in the price of oil. If anything, prices ‘should’ actually rise in the event of undersupply. What’s more, the surging US equity prices to record high levels point to improving economic conditions (the markets tend to lead the economy), which in turn implies even stronger demand for oil next year.
Technical outlook
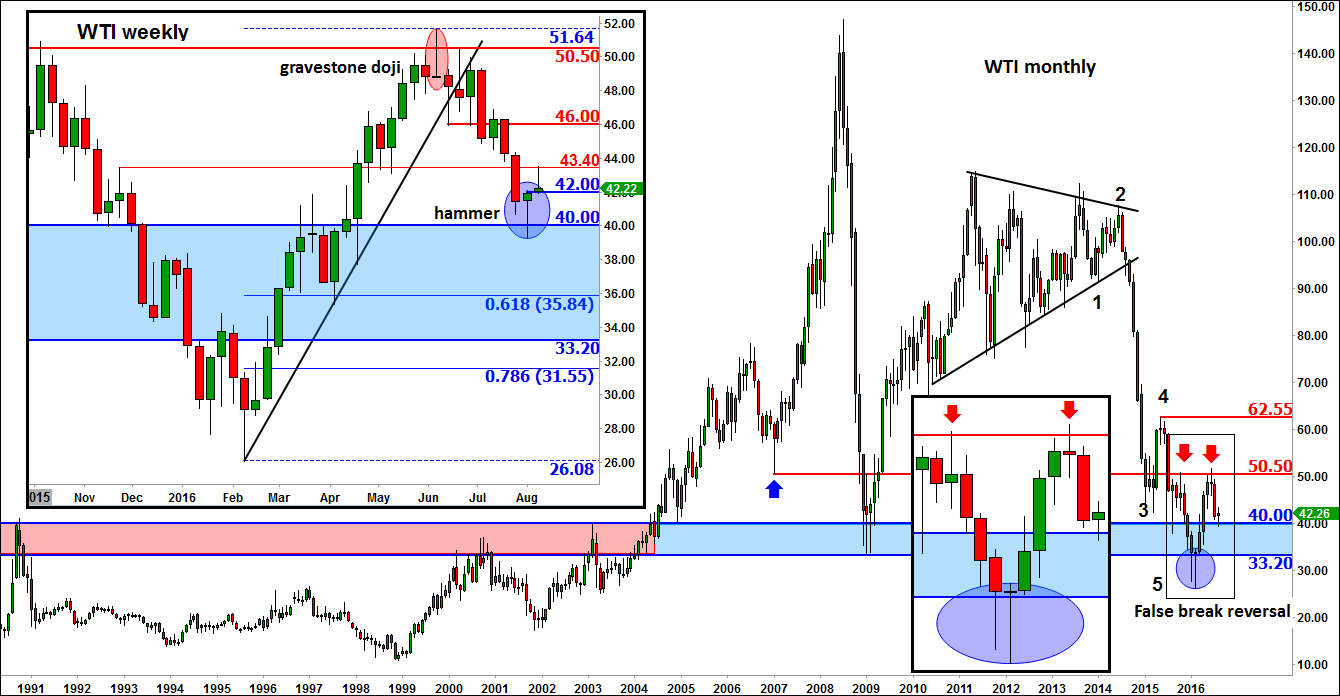
Now since I have talked about the long-term fundamental outlook, let’s remind ourselves of the long-term technicals for oil today. Below we have a monthly chart of WTI, with the weekly chart also shown in the inset. As can be seen, a bullish reversal pattern was formed in February of this year, namely a false breakout below prior low of $33.20, coupled with a doji candlestick formation on the monthly time frame. That reversal pattern obviously led to a sharp rally in the ensuing months as the shorts rushed to exit their positions and the bulls re-emerged in numbers. In the space of just a few months, the price of oil nearly doubled from its base of around $26.00 to hit a high of $51.65. These types of impulsive moves invariably pause at the very least, simply because of profit-taking. And that’s what happened at the start of the summer when oil created a bearish reversal pattern around the prior swing high of $50.50 (this also being close to the psychological level of $50). As you would expect, following its impulsive move higher, oil has since been in a corrective phase, shedding in the process more than $10. The drop of more than 20% technically means oil dropped back into the ‘official’ bear territory. But you have to put things into perspective. A 20% pullback after a near 100% rise is hardly a bearish move.
Indeed, as WTI oil remains well above its monthly reversal candle, the long-term outlook remains bullish in my view. The corrective move that began at the start of the summer has allowed the short-term oscillators to unwind from “overbought” levels, which means some momentum-based bullish traders can begin to look for new buying opportunities once again. Although oil has yet to pull back to the sweet spot of between 61.8 and 78.6 per cent retracement against its low, it may have created at least a temporary low last week. As the weekly chart in the inset shows, WTI oil formed a hammer candlestick formation when it re-tested the upper end of the long-term support range between $33.20 and $40.00. This particular candlestick pattern, when found at the lower end of a price swing, usually, but not always, precedes a reversal in the trend.
There was indeed a bit of follow-through in the buying momentum at the start of this week which ultimately failed when oil tested a short-term resistance level at $43.40. But the weakness has proved short-lived as oil is bouncing back at the time of this writing from short-term support and the top of last week’s range around $42.00.
Going forward, oil’s next move will depend on the direction of the break of short-term levels as per the weekly chart. If resistance at $43.20 gives way, which is our base case, then there is little further overhead resistance seen until $46. And if WTI then goes on to also break above $46, this could eventually lead to a revisit of the $50 handle once again (which I would then expect to break as well). Conversely, a break back below $42 would make the near-term technical outlook a little murky. And should $40 also give way then a deeper correction towards the 61.8 or 78.6 per cent retracement levels (at $35.85 and $31.55) against this year’s lows would then become likely.