Crude prices arrive at major hurdles
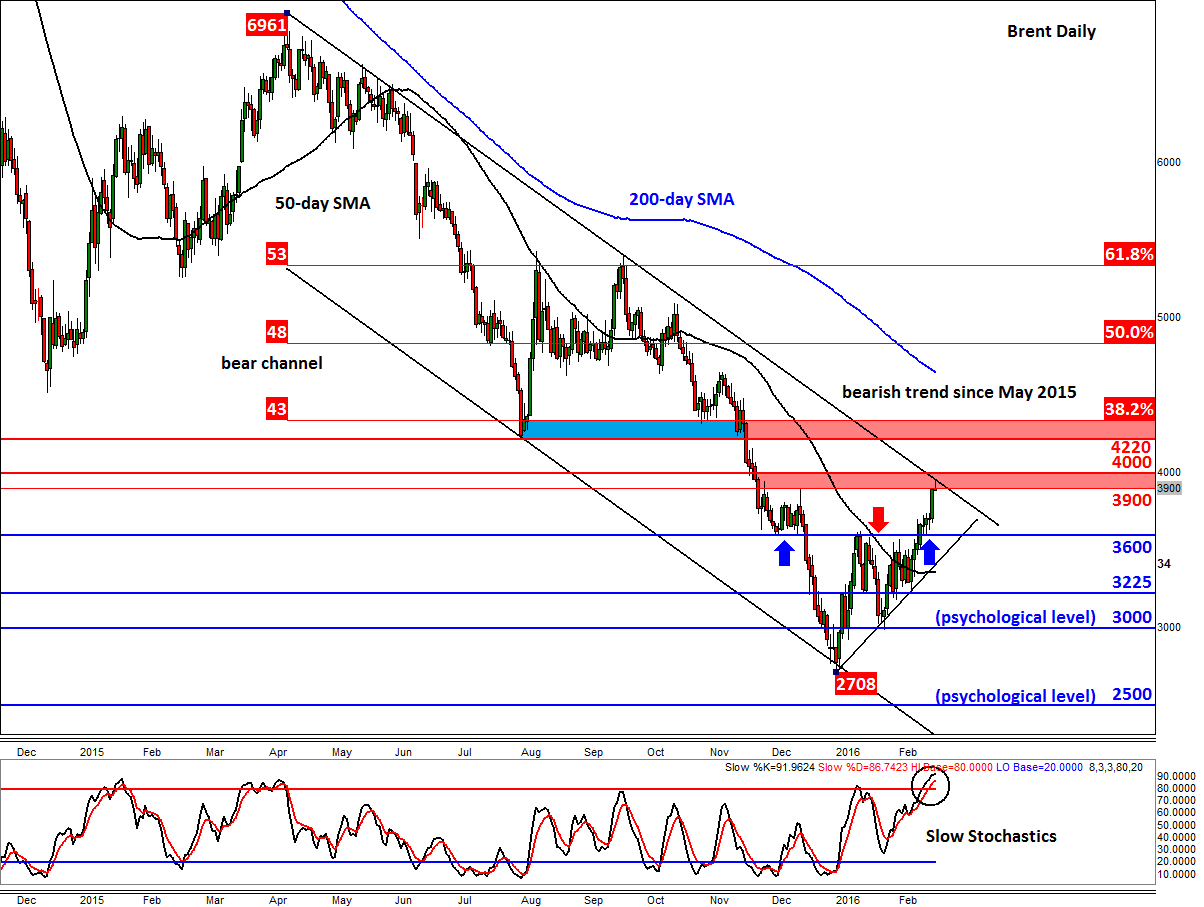
As we had expected, Brent oil has managed to climb all the way to the top of its bearish channel at $39.50, thus achieving its […]
As we had expected, Brent oil has managed to climb all the way to the top of its bearish channel at $39.50, thus achieving its […]
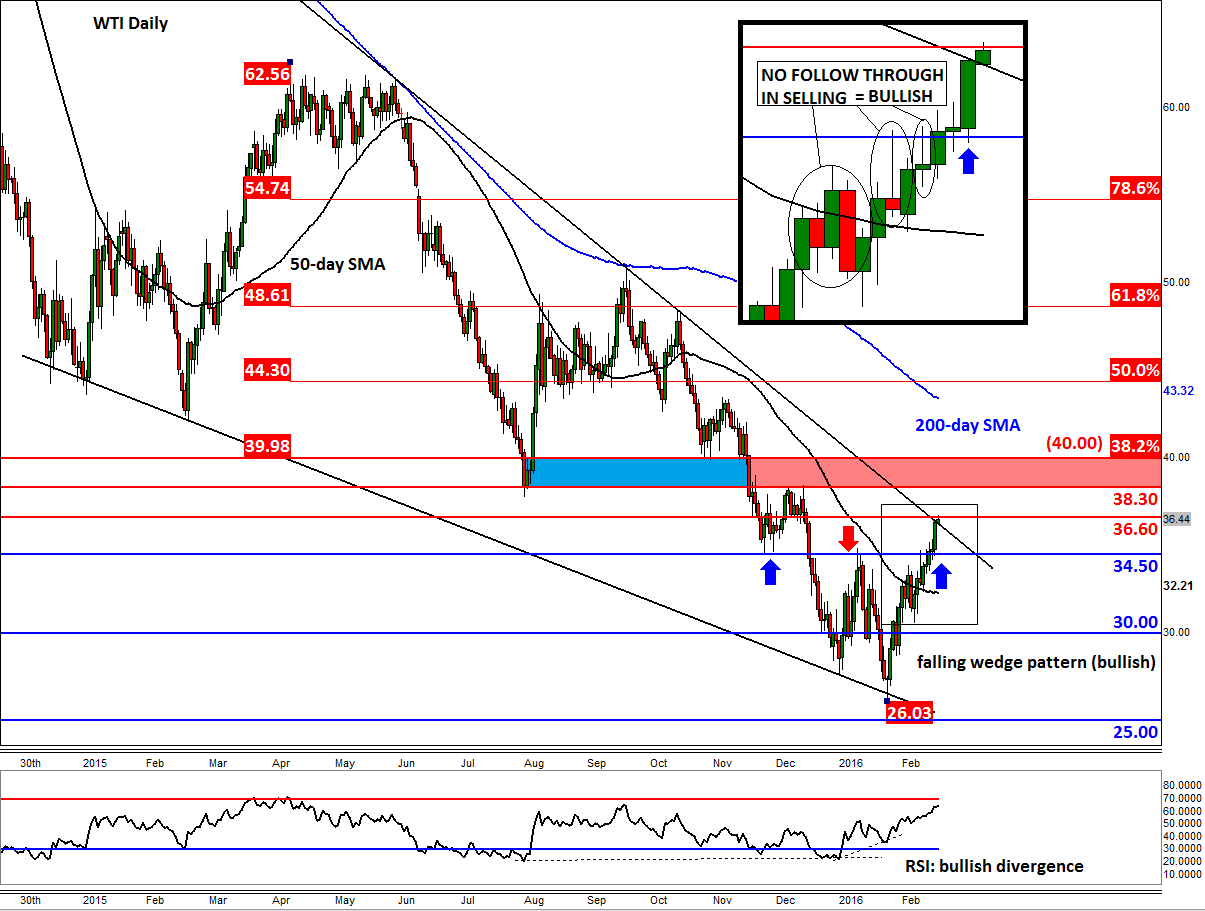
As we had expected, Brent oil has managed to climb all the way to the top of its bearish channel at $39.50, thus achieving its highest price level for the year. At the time of this writing, it was struggling to push further higher, most likely because of profit-taking from the buy side. Undoubtedly, a lot of people are also still fundamentally bearish on oil given that record amounts of the stuff is being produced by the OPEC and inventories in the US are still at all-time high levels. In addition, most of the positive news that had been supporting oil may be well priced in now, including the expected deal between Russia and OPEC to freeze production at January’s record levels. That being said, if hopes for a deal turn into reality this month, oil will almost certainly show a positive reaction. Further potential gains will depend to a great degree on the market’s view about the supply situation in the US. Here, oil production has decreased somewhat in recent weeks and the consistent falls in the rig counts point to further declines in output. Another 8 oil rigs were idled last week, according to the latest Baker Hughes data. The active numbers of rigs are now at their lowest level since December 2009. So far however, US oil producers have proved to be far more efficient and resilient than expected. It remains to be seen if all the existing US oil companies will still be in business should oil prices remain this low for a long time. The market clearly does not believe this will be the case and/or expects to see a more balanced oil market later in the year. If this were not the case, surely WTI oil prices would have responded more meaningfully to news of the sharp 10.4 million barrel build in US oil inventories last week. Yet, WTI actually held its own pretty well and on Friday broke through the key 34.50 resistance level.
Oil price may well be just pausing for a breath here, though it wouldn’t surprise me if it was more than just that. But recent price action has been noticeably bullish. For example, the inset of the WTI chart shows several bearish-looking candlestick formations on the daily time frame at or near key resistance levels. Yet, there was no corresponding follow-though in the selling pressure. This correctly pointed to a breakout above the $34.50 level which occurred on Friday. Similarly, if we see no significant follow-through in the selling pressure from other key resistance levels then one should expect to see oil go to higher levels in the near term. At the time of this writing, WTI was testing the upper resistance trend of its falling wedge pattern (bullish) at around $36.60. It should be noted that a decisive break above this level would be a further bullish outcome, while a failure here may see US oil drop back to test the broken resistance at $34.50 – the short-term bias would then turn bearish if this level breaks on a daily closing basis.
The chart of Brent arguably shows an even more interesting picture. As mentioned, the London-based oil contract is testing the resistance trend of its well-established bearish channel at $39.50. The slow stochastics momentum indictor shows Brent may be heavily overbought in the short-term. But, like WTI, if we observe the behaviour of recent price action we will notice that the bulls are apparently gaining control. If the sellers fail to show up around $39.00 to $40.00 then this would be a very bullish outcome. In this case, Brent may initially rally towards $42.20 to $43.00, an area which was previously support and corresponds with the 38.2% Fibonacci retracement. On occasions, the markets can remain overbought a lot longer than would normally be the case. But if oil turns lower, it may go for a re-test of the $36.00 level, a break below which would be deemed bearish. The outlook will turn completely negative if the rising short-term trend line also breaks down.