Crude oil weakness likely to be short lived
Buck-denominated crude oil prices fell sharply on Friday, along with gold and silver after the slightly stronger US jobs report gave the dollar what looks […]
Buck-denominated crude oil prices fell sharply on Friday, along with gold and silver after the slightly stronger US jobs report gave the dollar what looks […]
Buck-denominated crude oil prices fell sharply on Friday, along with gold and silver after the slightly stronger US jobs report gave the dollar what looks like a temporary boost. In addition, doubts continued over the potential oil-freeze deal between large OPEC members and Russia, which may help explain why – as CFTC data showed – money managers and hedge funds had trimmed their bullish positions on WTI for the first time in six weeks and increased bearish bets by the most since November in the week ending March 29. In truth, profit-taking after the very strong rally may be the number one reason for this, for nothing has changed fundamentally. Iran has once again re-iterated that it will continue increasing production and exports. The country rightly wants to boost its output near the levels it had been before nuclear-related economic sanctions were imposed and is therefore not interested in any deal to curb its output in the short-term. This is a big problem for some of the other large OPEC producers in the Middle East region as they do not want to give away market share by agreeing to limit their output to January levels, which was near record levels anyway. Russia’s oil output has meanwhile increased to the highest level in 30 years. But previous remarks from various oil ministers had suggested that a deal may be agreed upon with or without Iran’s participation. It is a perilous situation, but ultimately there is a consensus that something needs to be done. When there is a will there is always a way and so I think some sort of a deal will be ultimately reached.
But for now global crude oil supply remains more than required which is continuing to exert downward pressure on prices. However, most of the negative news is in the price and for oil prices to weaken materially, something big would have to happen now. In fact, US crude output is continuing to decline and the latest fall in the oil rig counts, down another 10 to 362 in the week ending April 1, means production there is likely to fall further in the months to come. Given this backdrop, and the potential for an oil-freeze deal this month, the global supply-demand imbalance is likely to fade as we progress towards the latter parts of this year. As such, oil prices look poised to recover further.
Technical outlook: Brent
Since peaking at key resistance of around $42.45/50 on March 18, the price of Brent oil has been generally trending lower. As the daily chart shows, below, this was previously a key support area. It was therefore very likely that after such a strong recovery, Brent would find some resistance there – not just because of profit taking, but also due to some selling pressure. The resulting price action on that day helped to form a doji candle at the top of the trend, correctly signalling that the rally had halted there. But is this just a short-term pullback or the start of another major leg lower?
As things stand, one would have to treat the recent weakness in Brent oil as a short-term pullback rather than the start of a new downward trend. Although oil may still be below the still-downward-sloping 200-day moving average, the 50-day average has recently turned higher. Meanwhile a couple of bullish trend lines have also been established, some major resistance levels have broken down and price has formed higher lows and a higher high, too. Only when these bullish trend lines or the key support area around $36.00/50 area breaks would I change my opinion. In fact, the pause here may well be a healthy development as far as the longer term outlook is concerned as it allows the short-term momentum indicators to unwind and work off “overbought” conditions before price stages another potential rally.
At the time of this writing, Brent had bounced off a key horizontal support level around $38.35, after hitting a low at $38.15 – a level which corresponds with the first of the two bullish trend lines as shown on the chart. Though this in itself is not necessarily a bullish development, oil traders may want to watch closely what happens next. If and when Brent breaks out of the bullish continuation flag pattern to the upside and takes out short-term resistance at $40.80 then that may be a sign that the rally has resumed. In this potential scenario, at least a revisit of the previous support-turned-resistance at $42.45/50 would become highly likely. However, if Brent breaks below today’s earlier low then we may see the oil price drop to the next bullish trend line or even all the way to the next key support around the $36.00/50 area before it makes its next move. So, it could be an important day for Brent as far as the technical are concerned.
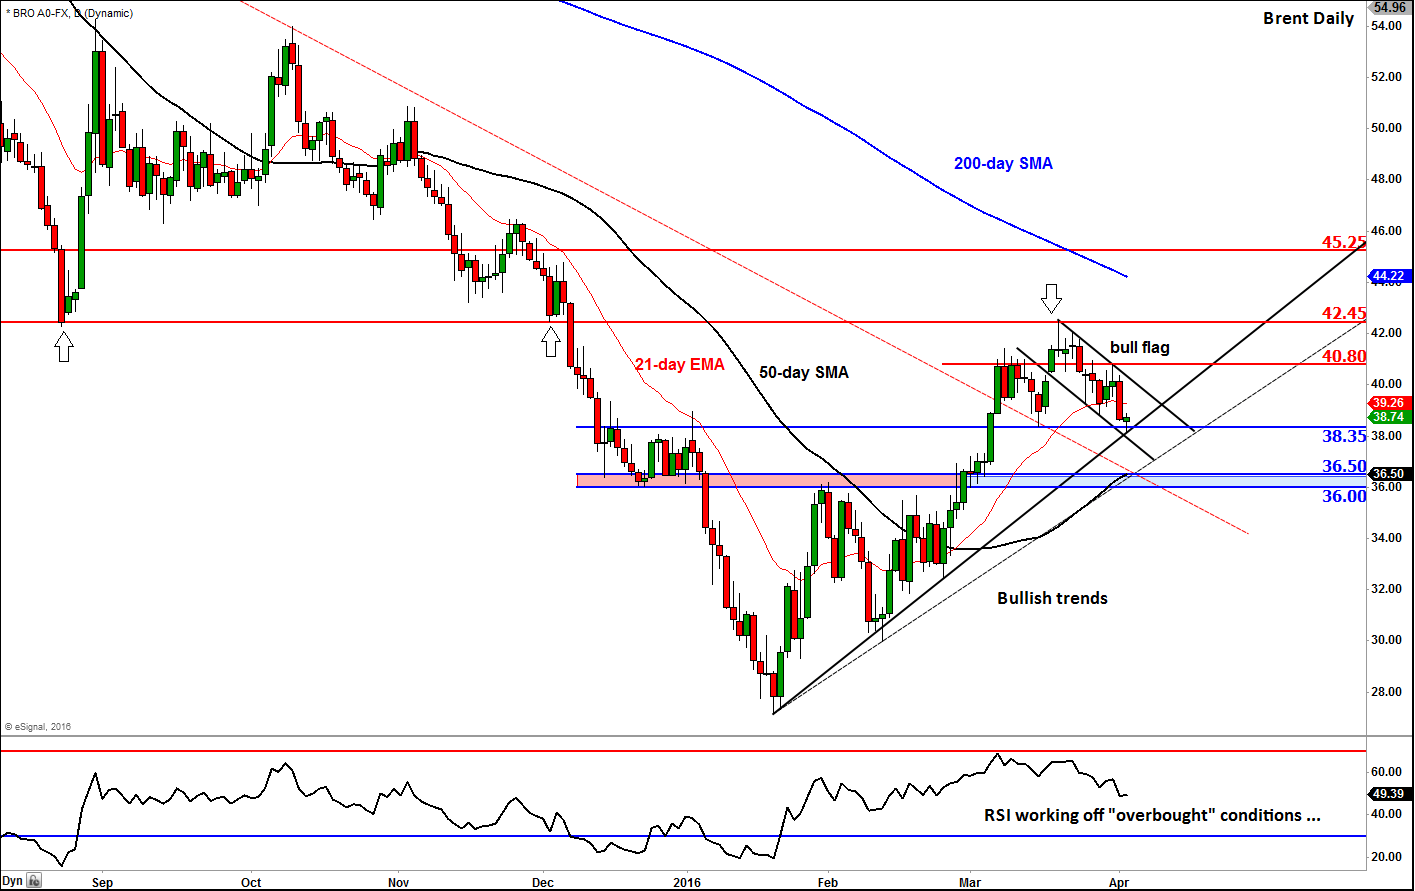
Source: eSignal and FOREX.com.
