


April 21, 2020 12:59 PM
Crude Oil, the Economy, and Volatility
With the selloff in May Crude Oil WTI futures yesterday, in which price traded as low as -$40.00, traders are asking what that really means as far as the world economy is concerned. As discussed yesterday, the move only reflected a small segment of the oil market. The May contract, which is currently trading near $0, expires today. This means that a majority of traders had already rolled their positions into the June contract. Yesterday’s capitulation on May Crude Oil WTI futures contract seemed to have little effect on other assets and asset classes, as the focus is now on the June contract.
Now let’s take a step back and think about the bigger picutre: In simplistic terms, NO ONE WANTED TO BUY CRUDE OIL AND RECEIVE $40 TO HOLD IT! Why? There is so much supply on the market already, there is literally nowhere to store it. However, yesterday, traders believed that in 1 month, there would be enough demand/less supply for the June contract to be worth $20.43. Today, traders are beginning to have doubts as the June contract is currently trading -25% under $15, with a low of $11.79.
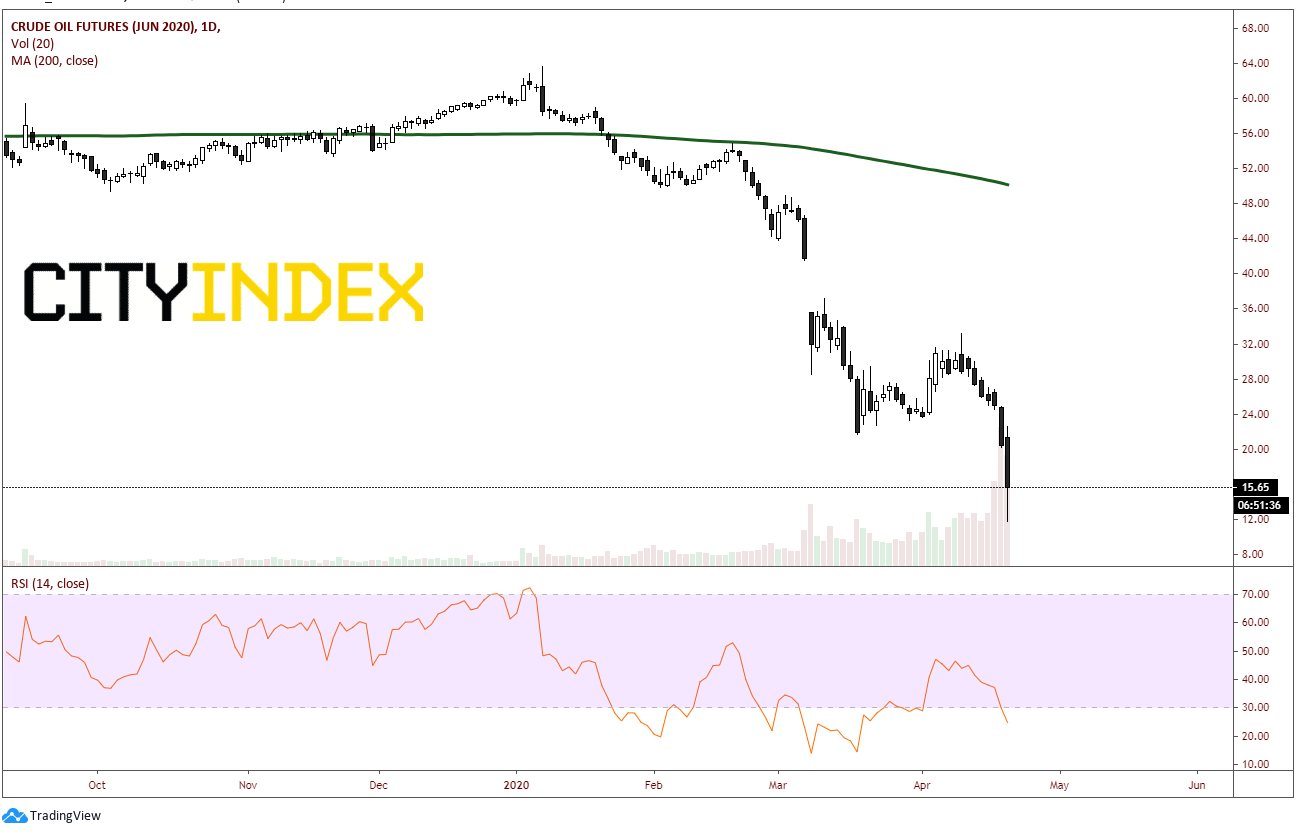
Source: Tradingview, NYMEX, City Index
Until the world can gain control of the coronavirus, the economic uncertainly will remain. And, as long as there is economic uncertainty, crude prices are going to continue to be volatile. There are sure to be fits and starts along the way, as some countries will begin to “re-open” and then have to slow down.
If one is looking to trade the crude volatility, but doesn’t want risk of futures or ETFs, one of the best instruments to trade as a surrogate is USD/CAD. Canada is an oil export led economy. Therefore, the price of crude oil plays a large part in the price of the Canadian Dollar. Notice on a weekly timeframe that since the beginning of the year, WTI Crude Oil and USD/CAD have become increasingly negatively correlated. The current correlation coefficient between the two assets is -0.96. A reading of -1.00 indicates that the two move perfectly together in opposite directions. The current reading of -0.96 is pretty close!
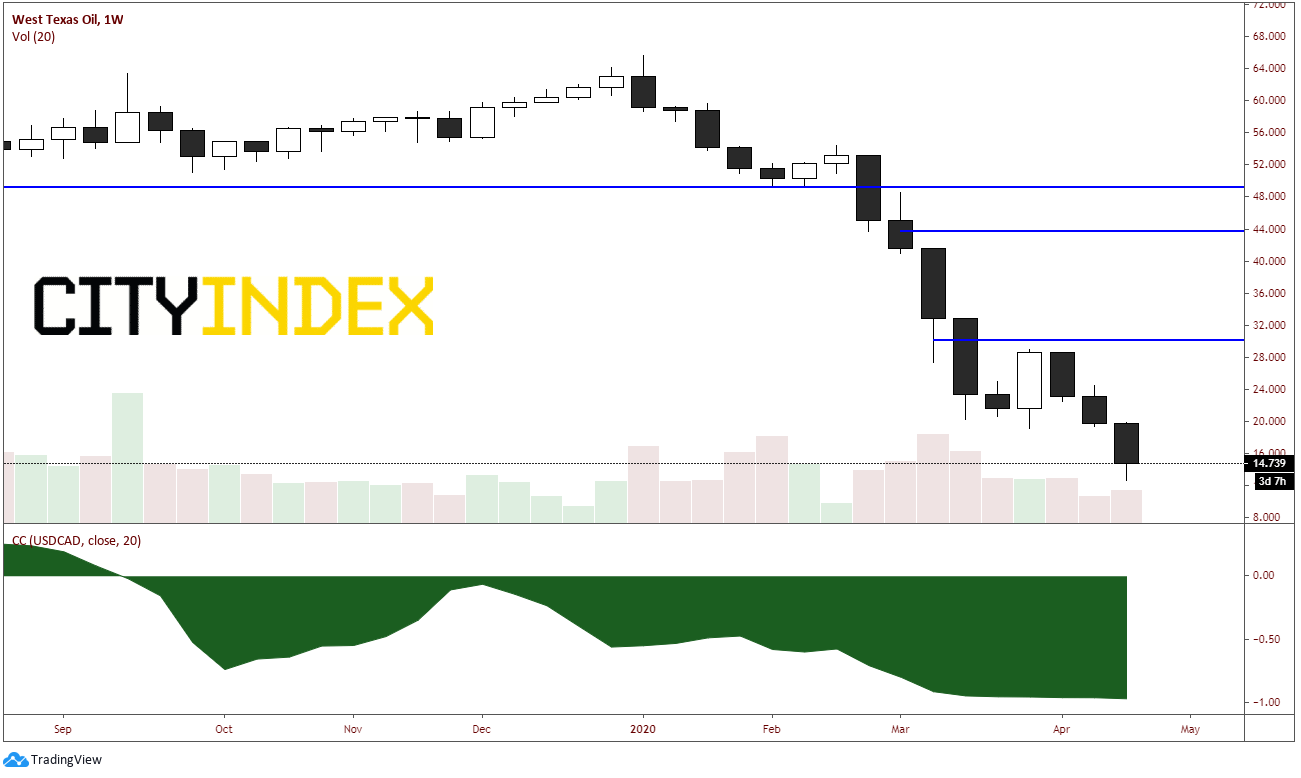
Source: Tradingview, City Index
USD/CAD put in a low at the beginning of the year just below 1.3000. Since then, price has traded to 1.4667 on March 19th and has been consolidating in a pennant like formation since. The pair had a false breakdown out of the bottom of the pennant on April 13th and shot back into the formation on April 15th. With the move lower in Crude Oil yesterday, the pair broke higher out of the triangle and is continuing to move higher today.
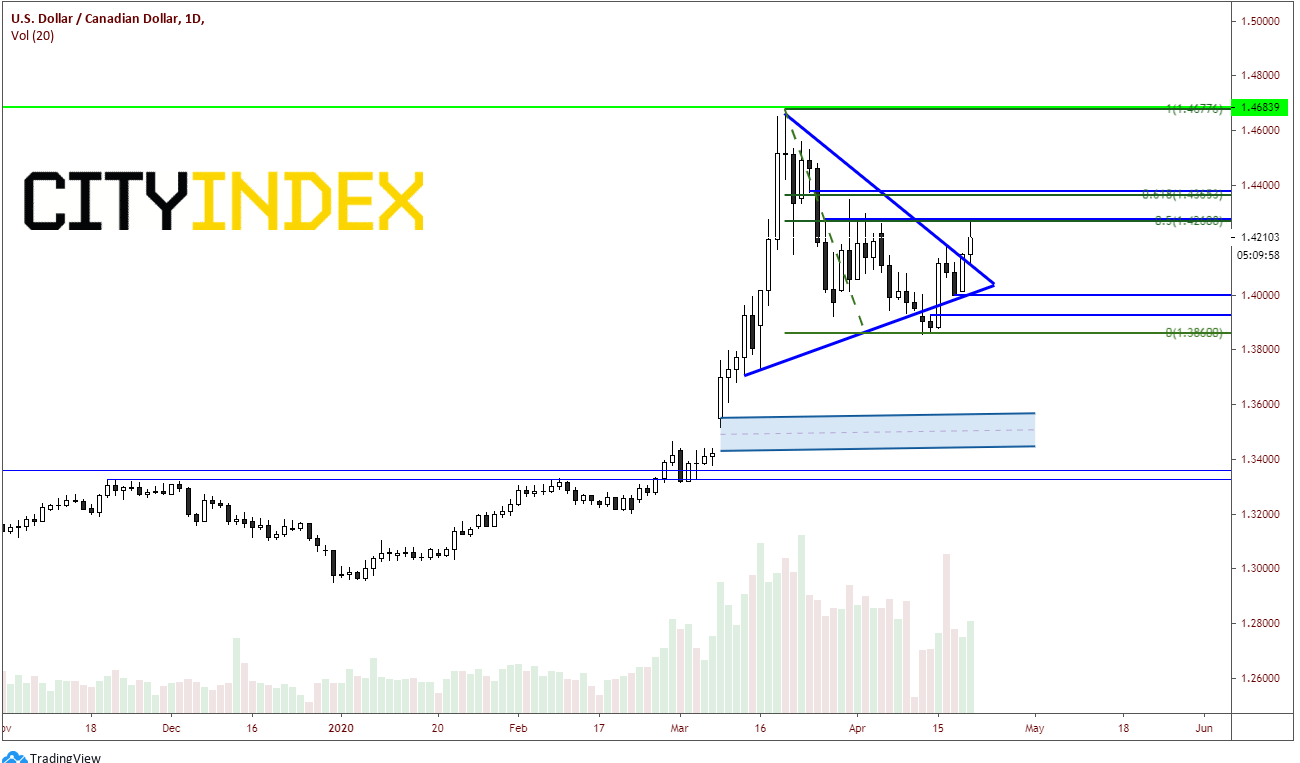
Source: Tradingview, City Index
Resistance is currently near the highs of the day, which is horizontal resistance and the 50% retracement from the March 19th highs to the April 13th lows near 1.4265. The next level is horizontal resistance and the 61.8% Fibonacci retracement from the same time period. Above that, price can run up and test the March 19th highs near 1.4675. Support crosses at the downward sloping trendline for the pennant near 1.4100. Below that is horizontal support, trendline support, and psychological support at 1.4000. If price manages to break through there, horizontal support is at 1.3925.
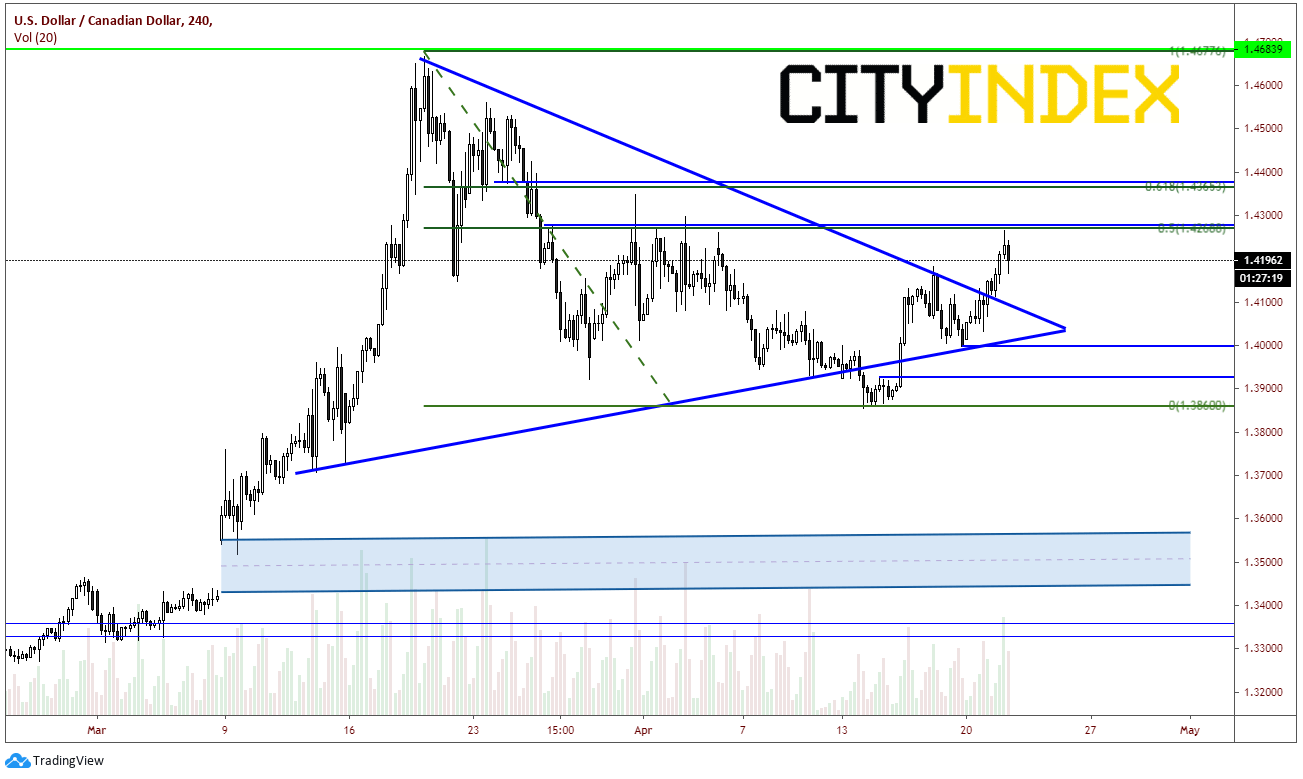
Source: Tradingview, City Index
Crude oil futures are expensive and extremely volatile to trade. However, if one wishes to take advantage of these without actually trading crude, USD/CAD will provide many of the same directional benefits at a relatively cheaper price and with relatively less volatility.
Latest market news
Yesterday 03:00 PM
Yesterday 01:12 PM
Yesterday 11:14 AM
Yesterday 08:28 AM
April 24, 2024 03:30 PM
Latest Oil articles
April 24, 2024 01:23 PM
April 23, 2024 01:15 PM
April 22, 2024 10:48 PM
April 22, 2024 03:42 AM