Crude oil rebounds
Crude supply data from the American Petroleum Institute on Wednesday had raised expectations that we would see the first inventory build in the US for […]
Crude supply data from the American Petroleum Institute on Wednesday had raised expectations that we would see the first inventory build in the US for […]
Crude supply data from the American Petroleum Institute on Wednesday had raised expectations that we would see the first inventory build in the US for six weeks. That was indeed the case, as it turned out. According to the US Department of Energy, the crude inventory build was 4.9 million barrels last week, which was easily more than that reported by the API and also above expectations. Consequently, WTI dropped to a low of $49.40 as the algos and human traders reacted to the headline number. However, traders were quick to close out their bearish positions after they read the details of the report and realised that stocks of Cushing crude, gasoline and distillates all fell quite sharply while total production also declined a tad. So, the oil report wasn’t as bearish as the headline crude build had suggested. As a result, oil prices were quick to jump back into the positive territory and WTI was trading back at a good $50.50 a barrel at the time of this writing. With the OPEC still widely expected to cut its production, oil prices could further extend their gains as we approach year-end. As before, I think a price range of $45 to $65 is where WTI is likely to spend most of its time.
Today’s bounce in oil prices also makes technical sense. In upward trends, markets tend to rebound on the third day of a counter-trend move. On the first day of the down move, the so-called “smart money” starts to take profit on long positions. This continues on the second day when the semi-smart money also reduces its exposure. On the third day, the not-so-smart market participants think that the uptrend is over and so they too start selling. Sometimes they sell right at or near the lows and this is when the smart money reloads the bullish positions. If this thesis is true, we ‘should’ see oil prices continue their advance on Friday and potentially beyond.
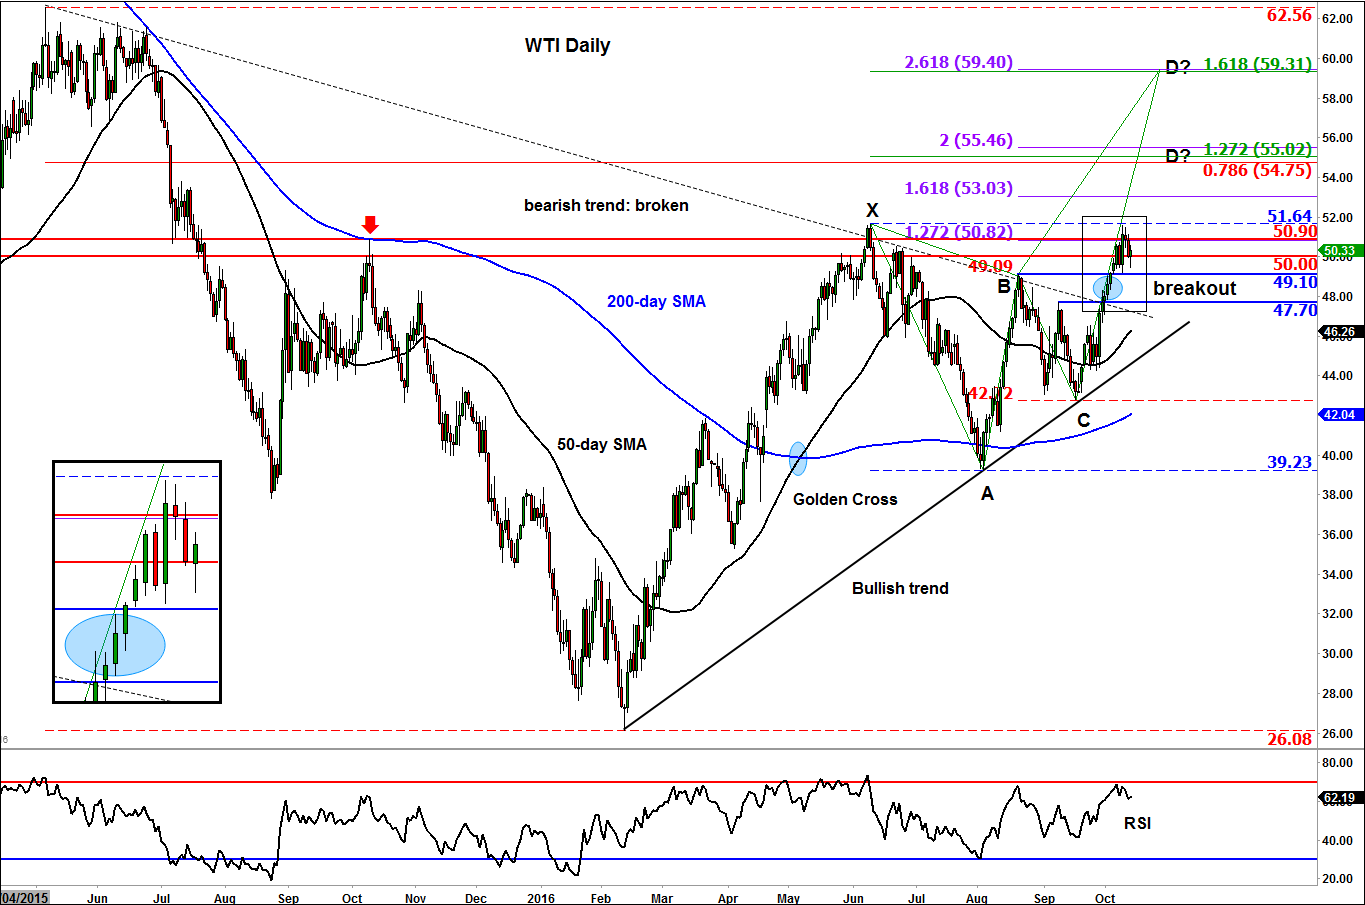
Indeed, the recent breakout above key short-term resistance levels means the path of least resistance is still to the upside for oil. This will only change in our view if WTI were to break back below support levels at $49.10 or ideally (“ideally” for the bears that is) $47.70. The bulls will now need to clear resistance at $50.90 and then top of the recent range at $51.65. If and when successful, the rally could potentially go much further as new momentum-based traders join in. A couple of very interesting levels that I would be watching, should we get there, are around $55 and then at $59.30/40. As can be seen on the chart, these are where several Fibonacci levels converge, which make them ideal profit-target areas for market participants who like myself use the Fibonacci tool in their analysis and trading. So there is the potential for WTI to climb to those levels and possibly find resistance there amid profit-taking.