Crude oil rebounds from new five year low
US crude oil (daily chart shown below), represented by the West Texas Intermediate (WTI) benchmark for light sweet crude, saw a substantial rebound of around […]
US crude oil (daily chart shown below), represented by the West Texas Intermediate (WTI) benchmark for light sweet crude, saw a substantial rebound of around […]
US crude oil (daily chart shown below), represented by the West Texas Intermediate (WTI) benchmark for light sweet crude, saw a substantial rebound of around 8% on Friday, the last trading day of January.
This significant jump occurred a day after the embattled commodity dropped to a fresh five-year low well below $44, signalling a new and troubling extreme.
Price action early on Monday has shown a continuation of Friday’s momentum, pushing crude oil briefly back up above the $50 level.
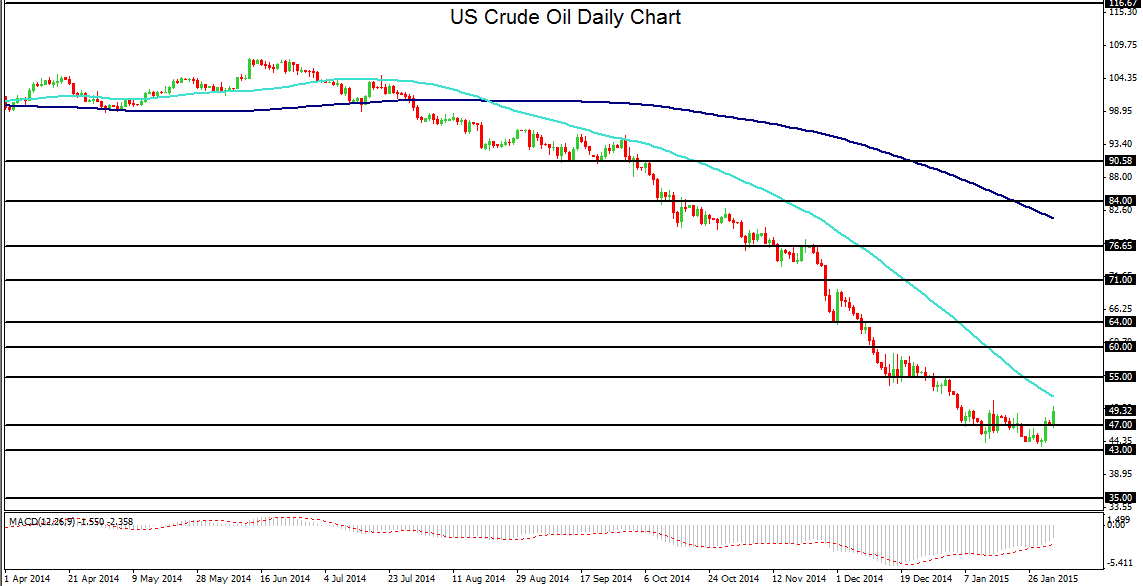
While the current rebound is encouraging and suggests a possible bottoming, the move may be considered mostly technical for the time being, as the fundamentals of increasing supply and waning demand have changed only modestly. This change comes mostly from the US, as it has begun to scale back on new projects and exploration in the face of plunging oil prices.
If other major oil players continue to maintain high production levels, however, February could potentially see further declines in oil prices into the low 40s and possibly lower before potentially bottoming out further into the year.
The $35 level continues to serve as the most important major support level to the downside in the event of a further drop. On a continuation of the current rebound, the next major resistance target to the upside resides around the $55 level.
