Crude oil rally gaining momentum
Crude oil prices have been repeatedly hitting fresh highs for the year in recent days. Just a month or so ago, they were dropping to […]
Crude oil prices have been repeatedly hitting fresh highs for the year in recent days. Just a month or so ago, they were dropping to […]
Crude oil prices have been repeatedly hitting fresh highs for the year in recent days. Just a month or so ago, they were dropping to fresh multi-year lows almost on a daily basis. The sudden turnaround has been triggered by a number of factors. Like every other rally, it all started as the sellers started to exit their positions. Bullish speculators then slowly started to pile in and more and more sellers withdrew as key resistance levels broke. Sentiment turned on investor realisation that the significantly lower oil prices boosted demand, most notably in China, and at the same time caused severe difficulties for oil producers, to such an extent that large OPEC members decided to talk with Russia about curbing crude output at January levels. Talks have been on-going for a couple of months now and so far there has been no real progress, with Iran unwilling to participate in such a deal. Despite this, oil market participants have apparently come to the conclusion that a deal to freeze oil production is forthcoming with or without Iran. Meanwhile, drilling activity in the US has been falling and recently oil supply has also started to decline. As such, the high global inventory levels should begin to fall.
So far however there’s been little evidence of that. If anything, crude stockpiles have actually risen further in the US. And there is a danger they may climb even more because of the seasonal maintenance works at this time of the year. But we think that by the start of the summer driving season, we should begin to see sharp declines in oil inventories as demand for gasoline, which is already strong for this time of the year, rises further. Our long-term view is that the potential gains for oil will be limited as US shale producers are likely to ramp up out once prices have recovered noticeably. But in the short to medium term, further gains are likely and that is exactly what the charts of crude suggest at the moment.
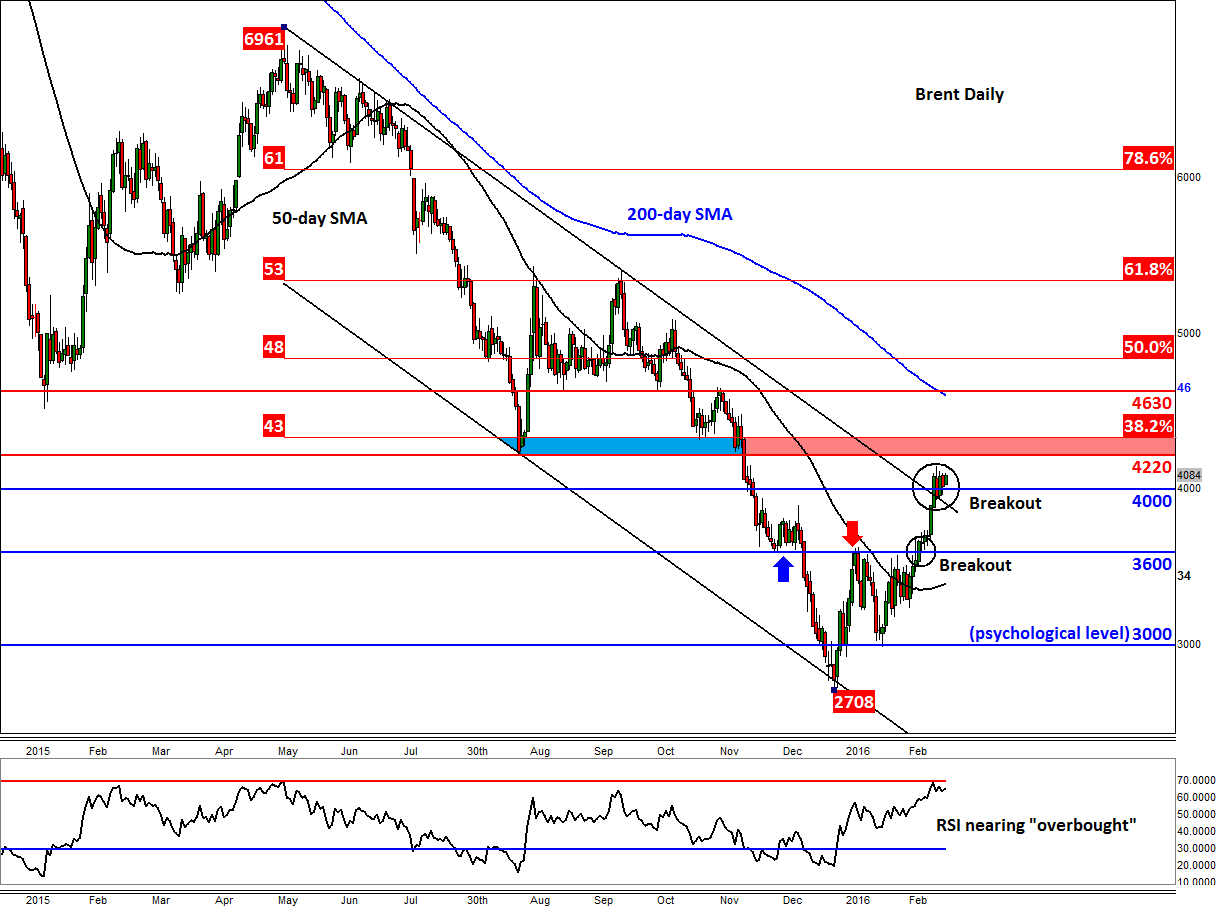
Brent technical outlook
Brent oil is trying to establish a short-term base above the broken resistance trend of the bearish channel around the $40 area. For as long as it holds above here now, the path of short term least resistance would remain to the upside. There are a couple of potential resistance areas worth watching closely now. The first is between $42.20 and $43.40, an area which was previously support and corresponds with the 38.2% Fibonacci retracement against the May 2015 high. Above this level, the 200-day moving average comes in around the pivotal area of $46.00-46.30.
For Brent a potential break back below the broken trend would be deemed a bearish outcome, in which case a drop to old resistance at $36.00 would become likely. The momentum indicator RSI is nearing the “overbought” threshold of 70. For this reason, a short-term pullback from around the above-mentioned resistance levels would not surprise me. But the RSI is a lagging indicator and can remain “overbought” for a long time.
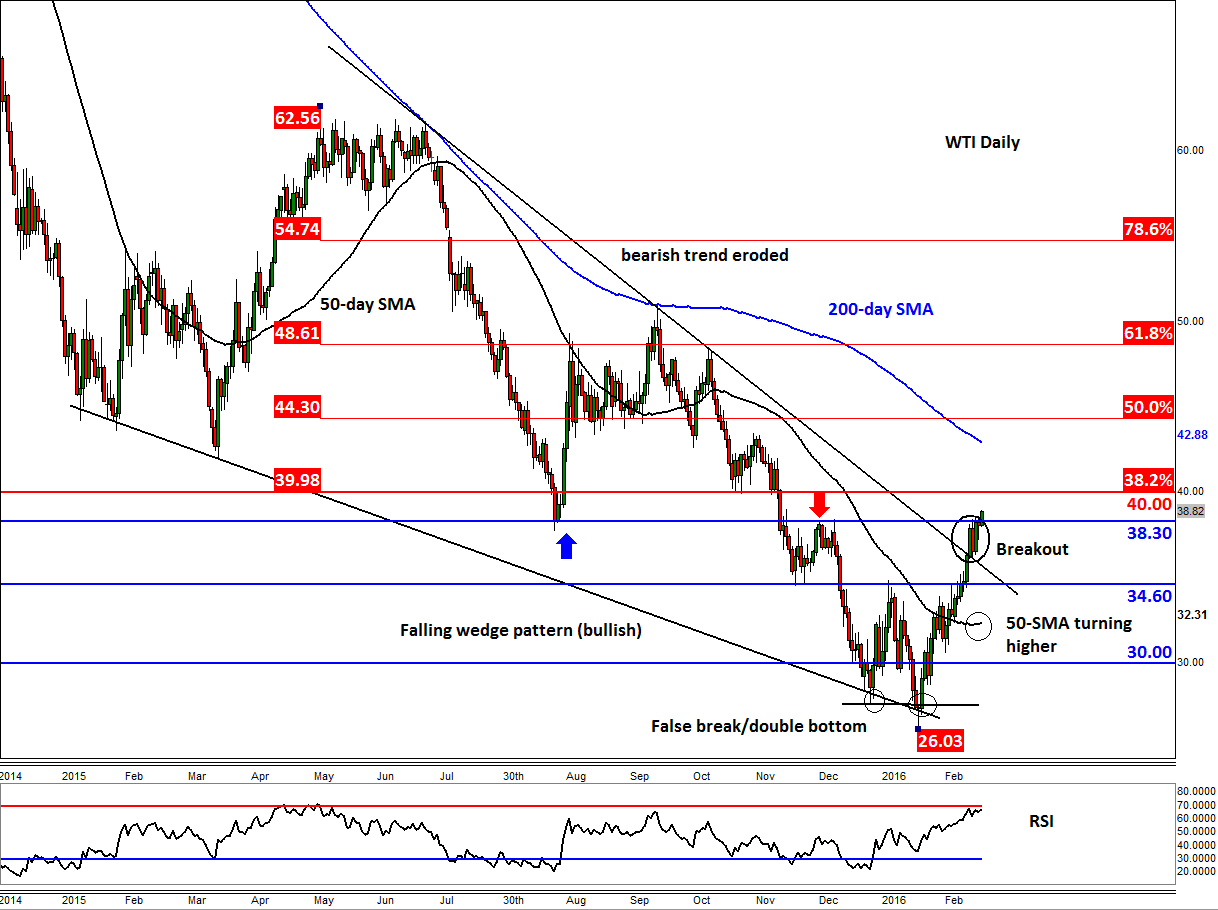
WTI technical outlook
The daily chart of WTI oil is similarly looking bullish after the US oil contract formed a double bottom reversal pattern around the $26/$27 area in February. Since that low was formed, we have been bullish on oil and continue to remain so until the chart tells us it is time to change our view. In fact, the bullish trend is gaining momentum. WTI has actually broken out of its falling wedge pattern to the upside and now is trading above the old resistance at $38.30. It looks like the bulls are now aiming for the psychological level of $40 as their next immediate target, for this level was also previously support and converges with the 38.2% Fibonacci retracement against the May 2015 high.
But like Brent, WTI’s RSI indicator is approaching the “overbought” threshold, so do watch out for a potential pullback from around $40 or another key resistance level. But given the recent bullish-looking price action, any short-term pullback would be deemed healthy as it would help to unwind the momentum indicators from the overbought levels. What would be even more bullish is if the RSI drifts lower as a result of a tight consolidation due to the passage of time rather than a significant drop in WTI. Our short-term outlook would turn bearish if WTI breaks back below the broken trend line and more so if support at $34.60 also breaks down on a daily closing basis. Until and unless that happens though, the path of least resistance remains to the upside.