Crude oil on the verge of a big breakout
Both crude oil contracts are up for the third consecutive day, with Brent currently trading above the psychologically-important and key resistance level of $50 and […]
Both crude oil contracts are up for the third consecutive day, with Brent currently trading above the psychologically-important and key resistance level of $50 and […]
Both crude oil contracts are up for the third consecutive day, with Brent currently trading above the psychologically-important and key resistance level of $50 and WTI above $47 a barrel. Oil prices have been supported by a number of factors lately, including the unwinding of bearish positions, a slightly weaker US dollar, the positive vibes arising from the rebounding stock markets and Russia’s military actions in Syria which has increased supply-side risks in the Middle East region. But above all, it is expectations that US shale oil output is going to start shrinking soon, making the crude market more balanced. At the moment, the market is still pretty much imbalanced due to the relentless increases in supplies, first arising from shale producers in the US and elsewhere and now from the OPEC. But prices have now been depressed for a long-enough period of time to cause uncomfortable pain for some small and inefficient oil companies, most notably in the US. Here, we have seen renewed falls in the active rig counts, with the number declining by an additional 26 rigs last week. At ‘just’ 614, drilling activity is now at its lowest level since August 2010, which points to a potentially sharp drop in US oil production. Oil prices could therefore start rising from these depressed levels over the coming weeks and months as traders adjust their expectations about the future supply and demand equilibrium levels. However, it is important to remember that when prices rise by a noticeable margin and US oil companies start making good profit once more, it will be easy for them to resume drilling and expand production as after all the infrastructure is already there. This will likely cap the gains for both contracts. So, while oil prices could easily extend their gains in the short term, it is questionable whether the potential gains could be maintained in the slightly longer term point of view.
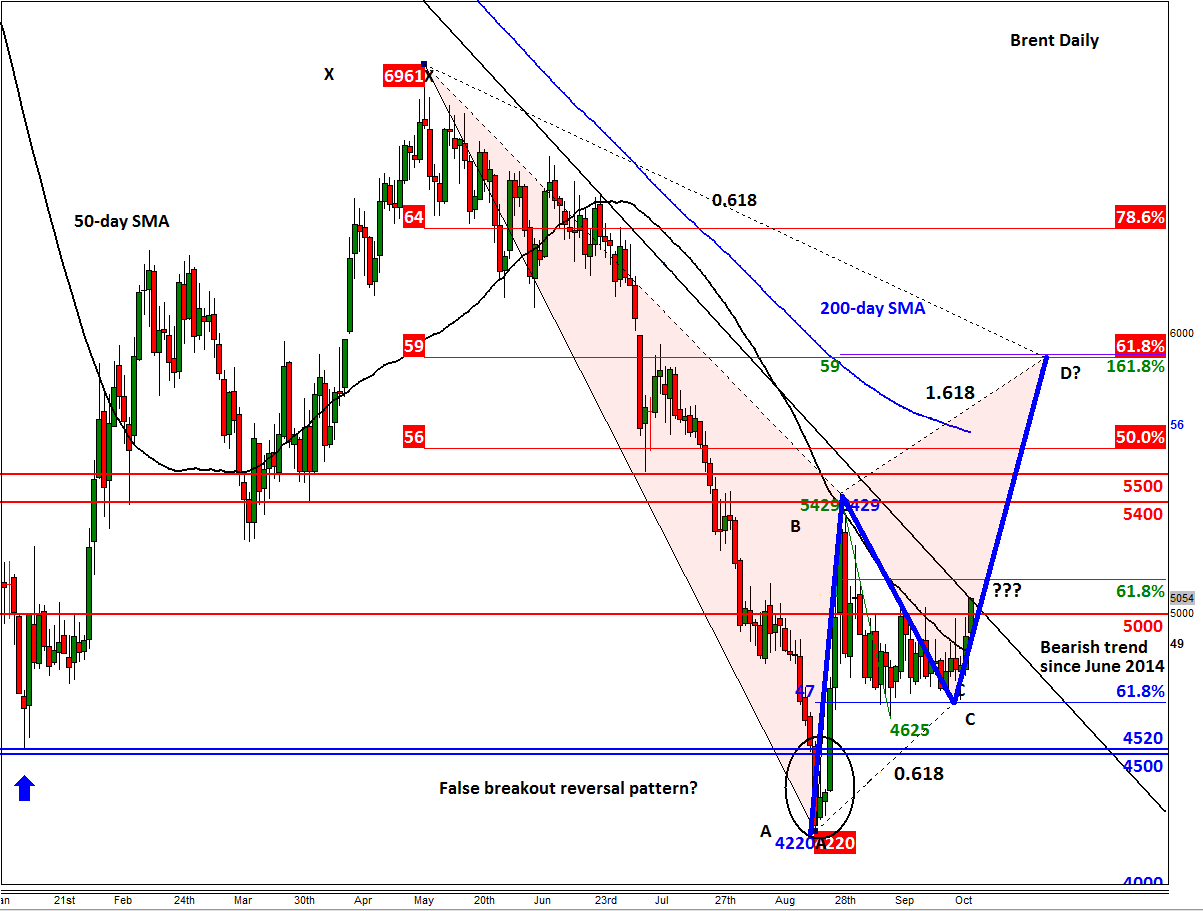
Nevertheless, from a technical point of view, both contracts are testing important levels and are potentially on the verge of a big breakout. Brent is currently testing a bearish trend line that goes back all the way to the summer of last year (i.e. that is when oil prices first started to decline). This trend line comes in around $50.50. A decisive break above here could see Brent easily rally to $54/55, the previous support-turned-resistance area, before making its next move. But as the chart shows, below, there is also the possibility that oil may have already put in a major bottom when it failed to hold below the prior 2015 low of around $45 in the summer. We saw a big rally after that false breakdown at the end of August before prices went into consolidation for the best part of September.
Following that sharp rally and the corresponding consolation phase over the past month or so, we have been continually looking for bullish signs around the 61.8% Fibonacci level at $47 or the previous support around $45. As it has turned out, the 61.8% Fibonacci level has in fact turned into a major support level for Brent. If the London-based oil contract now breaks decisively above the bearish trend line, which appears very much likely, then it may be able to rally all the way to the projected Bearish Gartley entry point at $59. This is where the 61.8% Fibonacci retracement level of the last significant downswing from May meets the 161.8% extension of the downward move from the high that was achieved at the end of August. However, if the bearish trend holds and price ends back below the $50 handle then we could see a sharp unwinding of the bullish positions later this week and thus a quick retreat.
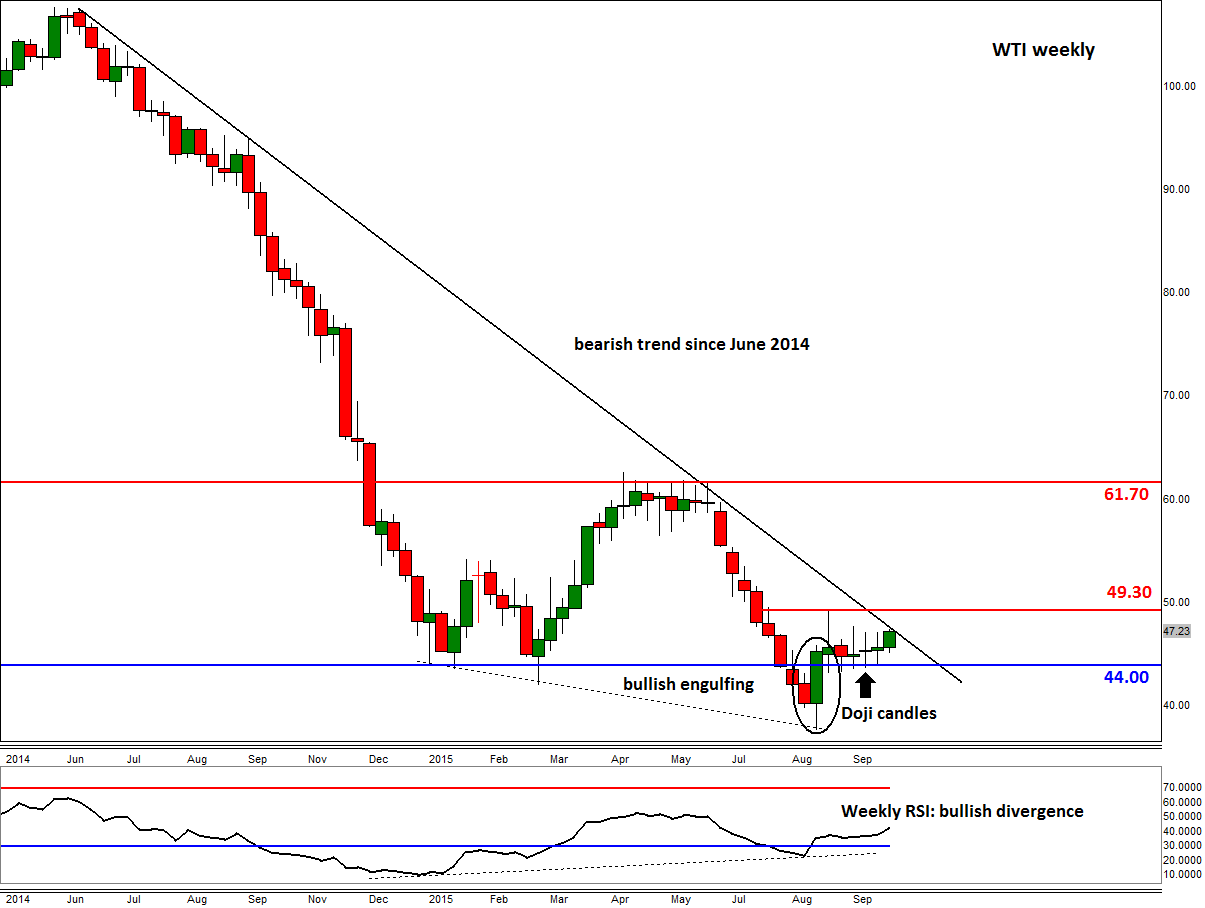
Likewise, WTI is testing its own bearish trend line around $47.30 and is therefore on the verge of a big break out should the bulls win the battle here. This week’s rally was preceded with a period of indecisive price action as highlighted by the three doji candles on the weekly chart. Those had been formed after the creation of a large bullish engulfing candle we saw at the end of August when the sellers were unable to hold their ground below the prior 2015 lows of $42-$44 range. In other words, WTI is displaying pretty much the same technical setup as Brent.
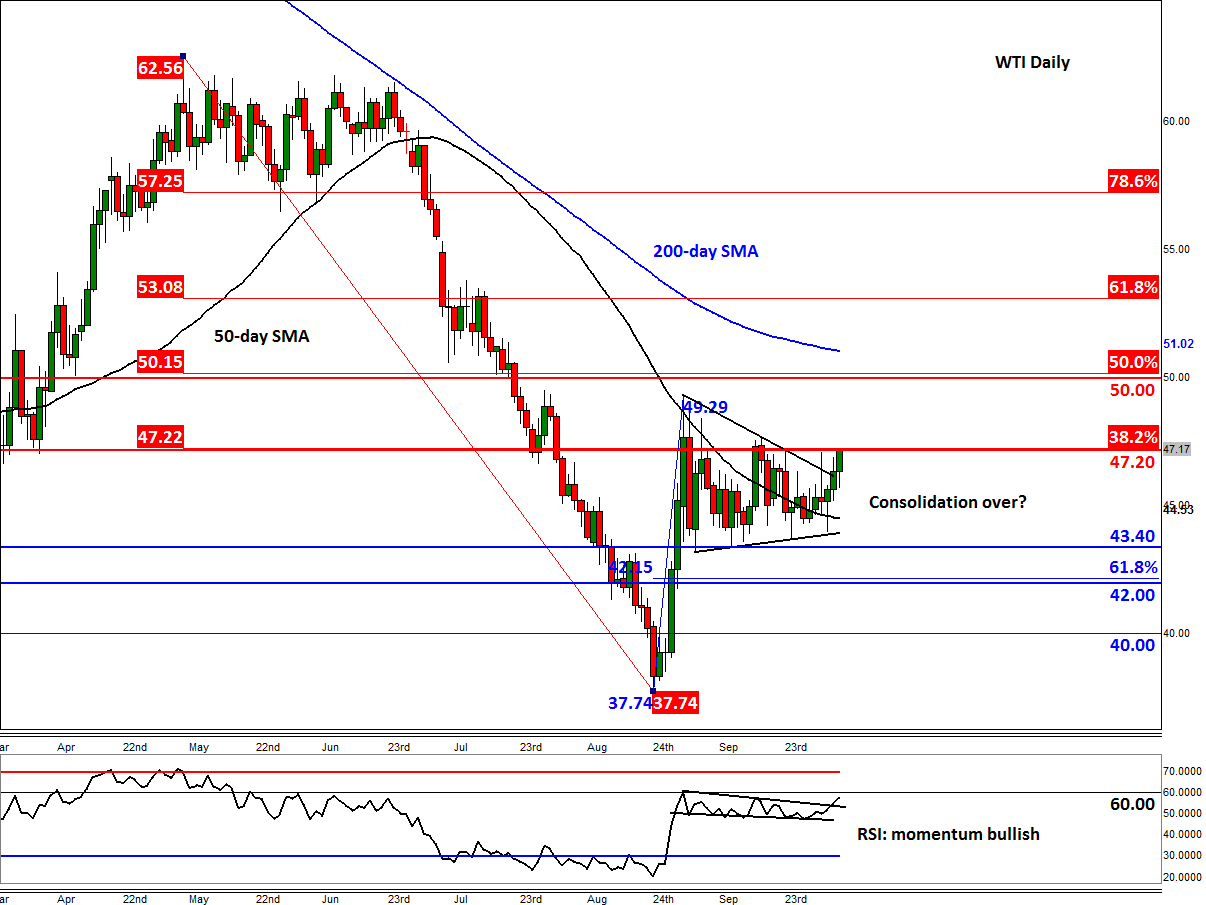
The daily chart of WTI meanwhile shows that US oil has potentially ended its consolidation phase and is ready to move higher. Correspondingly, the momentum indicator, RSI, has also broken out of a tight range, though it is still holding below the key 60 level. If the RSI breaks above 60 at or around the same time as WTI potentially takes out its bearish trend line, then this would confirm the breakout and would thus paint a very bullish outlook.
While the bulls and bears battle it out, conservative traders are probably just waiting on the side-lines for crude to make up its mind before coming back into the game. As things stand, a weekly close below $44 for WTI would be a bearish outcome while a break above the trend line and ideally the August high of $49.30 would be a bullish scenario. Once these would-be sellers or, perhaps more likely, buyers show their presence then oil prices could sharply extend their moves in the direction of the breakout.