Crude oil indecisiveness should end soon
Judging by the recent price action, it seems as though oil speculators are almost convinced about an imminent drop in US crude output, which is […]
Judging by the recent price action, it seems as though oil speculators are almost convinced about an imminent drop in US crude output, which is […]
Judging by the recent price action, it seems as though oil speculators are almost convinced about an imminent drop in US crude output, which is needed in order for the current supply excess to be reduced in a meaningful way. But increased output from the OPEC and potentially Russia may help to keep the global glut fully replenished, which together with growing concerns about a sharp economic slowdown in China could help to prevent oil prices from rising noticeably. With speculators clearly undecided about which of these arguments carry more weight, oil prices are continuing to alternate between gains and losses. Indeed, after dropping sharply yesterday, both crude contracts have now more than made up those losses.
Oil speculators are looking forward to the release of the latest crude stockpiles data from the American Petroleum Institute (API) and Energy Information Administration (EIA). The API will report its numbers on Tuesday night while the official EIA’s report will be published Wednesday afternoon. Over the past couple of weeks, there have been surprise falls in US stockpiles; surprise because it is unusual at this time of the year for inventories to fall, with the seasonal driving season now over. If we see further sharp drawdowns in crude stocks then that could help support oil prices, while a run of sharp builds now should intensify excessive supply concerns once more. As well as the US crude stocks data, traders will focus this week on the latest Chinese manufacturing PMI numbers on Thursday. If the current trend of weaker economic data continues, oil prices may fall back on demand concerns. The potential impact of US economic data on oil may be felt through the reaction of the dollar, which implies that bad US macro data may actually be good news for buck-denominated commodities like oil and gold, and vice versa.
Technical view: WTI
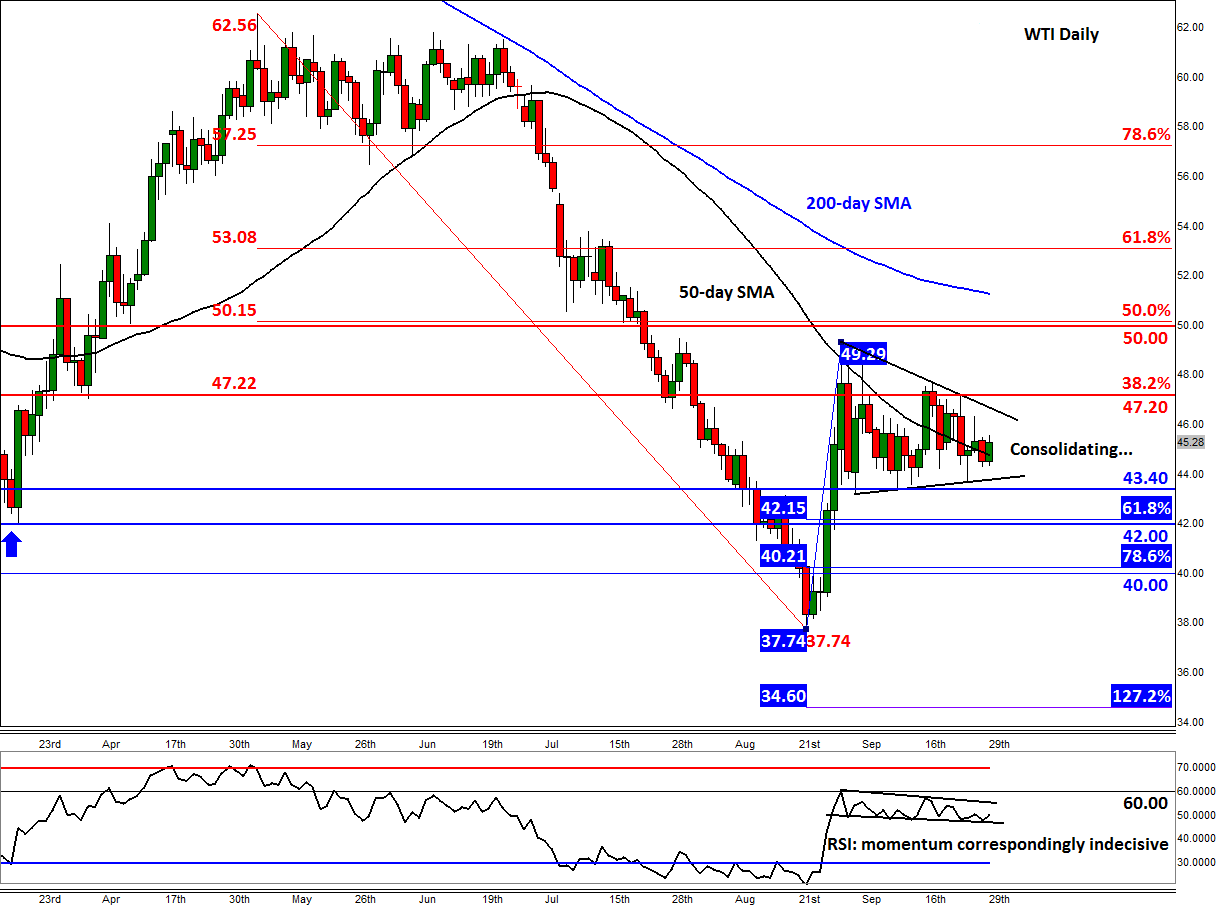
As the daily chart of WTI shows, in figure 1, US oil is effectively in consolidation mode as it oscillates around its 50-day moving average in a pennant-like formation circa $45 a barrel. Correspondingly, the momentum indicator RSI is also stuck in a tight range, holding below the key 60 level. If the RSI breaks above 60 then this could precede a breakout in the underlying prices, while if the indicator moves below 40 then it would confirm renewed bearish momentum.
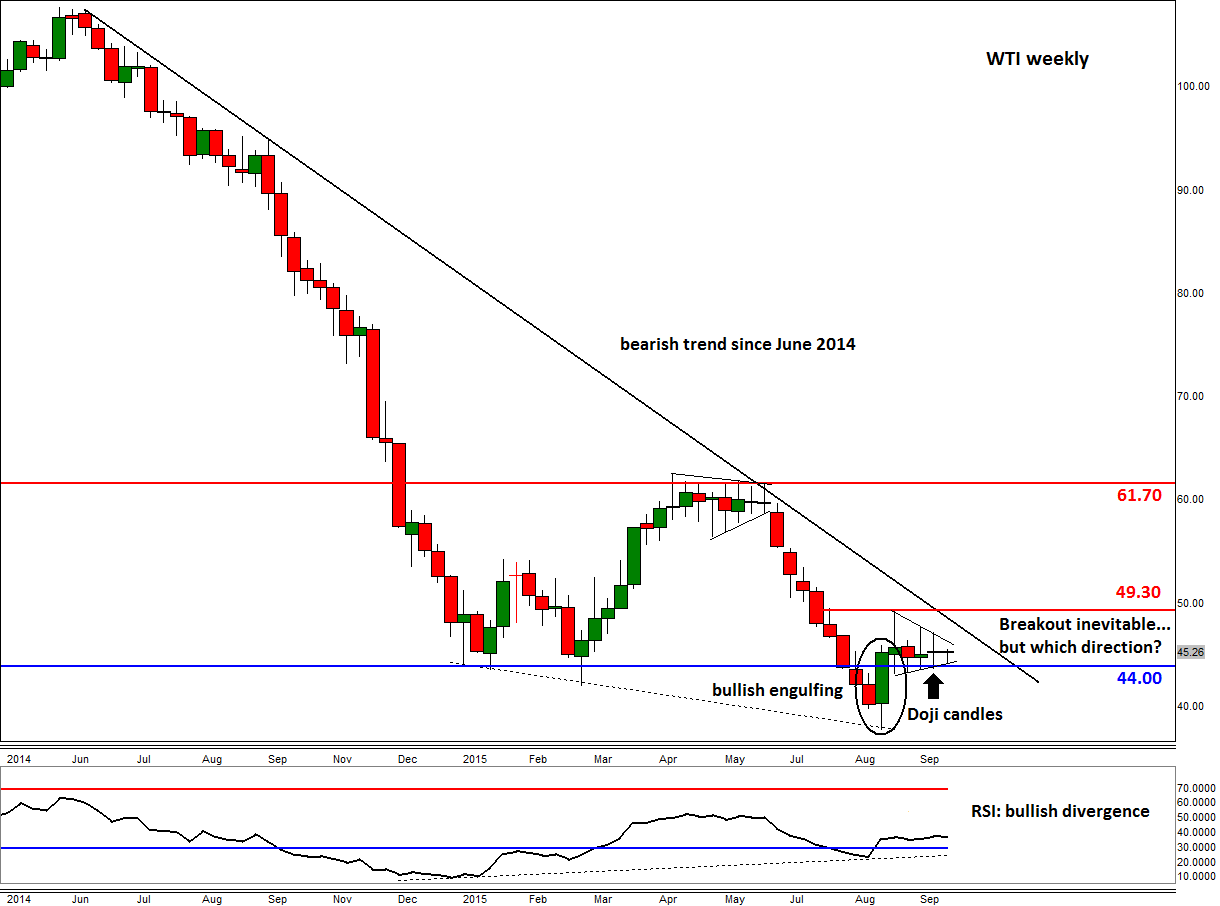
A quick look at the weekly chart of WTI, in figure 2, reveals a similar indecisive price action: doji candles. A doji candlestick is formed when the opening and closing prices are roughly the same with the candles containing wicks on either side. As can be seen, two such candles have already been completed and a third one is potentially being formed this week. These doji candles have been formed after the creation of that large bullish engulfing candle we saw at the end of August when the sellers were unable to hold their ground below the prior 2015 lows of $42-$44 range. Although that may have been a false breakdown and a potential reversal formation, the lack of further follow-through in buying momentum has decreased the probability of such an outcome. But interestingly, the lows of the candles of the past four and a half weeks have been near the upper end of this $42-$44 range, suggesting that the potentially bullish setup may still be in the development phase.
While the bulls and bears battle it out, conservative traders are probably just waiting on the side-lines for WTI to make up its mind before coming back into the game. As things stand, a weekly close below $44 would be a bearish outcome while a break above the trend line and ideally the August high of $49.30 would be a bullish scenario. The good news is that oil prices will soon break out; the bad news is that at this moment it is extremely difficult to say which direction the breakout will be. Either way, the inevitable breakout should open some good trading opportunities in crude.