Crude oil in consolidation mode ahead of OPEC meeting
Having momentarily surpassed the $50 hurdle, Brent and WTI suffered from profit-taking in the second half of Thursday’s session before extending their losses slightly on […]
Having momentarily surpassed the $50 hurdle, Brent and WTI suffered from profit-taking in the second half of Thursday’s session before extending their losses slightly on […]
Having momentarily surpassed the $50 hurdle, Brent and WTI suffered from profit-taking in the second half of Thursday’s session before extending their losses slightly on Friday morning. Despite the pullback, both oil contracts still looked set to close higher for the third straight week. Oil prices have been boosted by a number of factors lately, including the unscheduled production outages, continued output decreases in the US and strong demand for gasoline at the start of the driving season. According to the Energy Information Administration, oil production in the US fell by an additional 24,000 to 8.767 million barrels per day in the week to May 20 as total crude inventories decreased by a sharper-than-expected 4.23 million barrels on the week. After falling for 17 out of the past 18 weeks, oil production in the US is now at the lowest level since September 2014.
As oil prices continue to rise however, it will become lucrative for US shale oil companies to ramp up production once again, which could put a ceiling on oil prices. First to respond will probably be the rig counts, which failed to decrease last week for the first time since mid-March and only the second time this year. If the counts begin to stabilise or start to climb then this should be a warning sign for the on-going oil price rally. Baker Hughes will be reporting this week’s data later on Friday’s session. Meanwhile hedging by oil companies to lock in a higher sell price for future delivery may also help to halt the oil rally. That being said, it is impossible to say at what price the impact of these bearish factors will start to outweigh the bullish dynamics. But we have now entered the lower band of the $50-$70 range many think will probably be the top for this current cycle.
OPEC meeting in focus
As well as key US data, which could have significant implications for the timing of the next Federal Reserve rate decision and therefore the dollar and in turn buck-denominated commodities, next week’s focus will sharpen on the OPEC meeting which is scheduled for Thursday, June 2. After the Doha meetings failed to find an agreement on freezing production, this regular OPEC meeting is unlikely to yield a different result, not when Iran continues to re-iterate that it has no intension of capping its oil production or exports. And with the recent cabinet re-shuffle in Saudi Arabia, the cartel may well continue the Saudi-led policy of flooding the market to drive weaker US shale producers out of business. The OPEC will no doubt use the recent supply disruptions in Canada, the falling output in the US and the firmer oil prices as reasons not to cut production. After all, Saudi’s strategy has finally began to work, so why change it now? In the likely event the OPEC maintains status quo, oil prices may fall, at least initially anyway, as some people are still expecting the OPEC to “do something.” But as our and most other oil analysts’ base case is for no change, the biggest risk would therefore be if the OPEC did actually agree to cut production. This potential scenario would almost certainly lead to a sharp rally in oil prices.
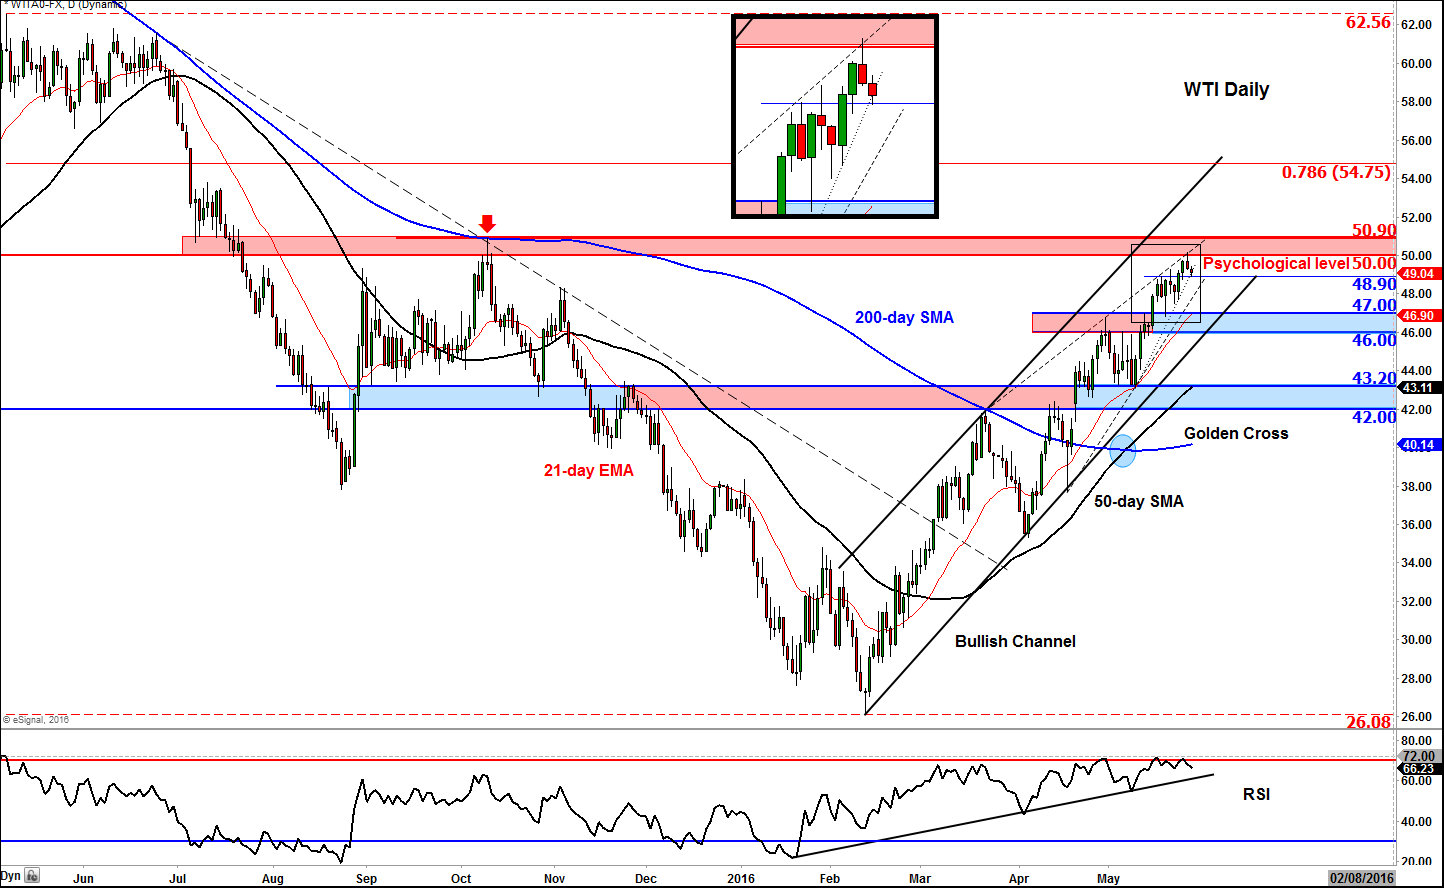
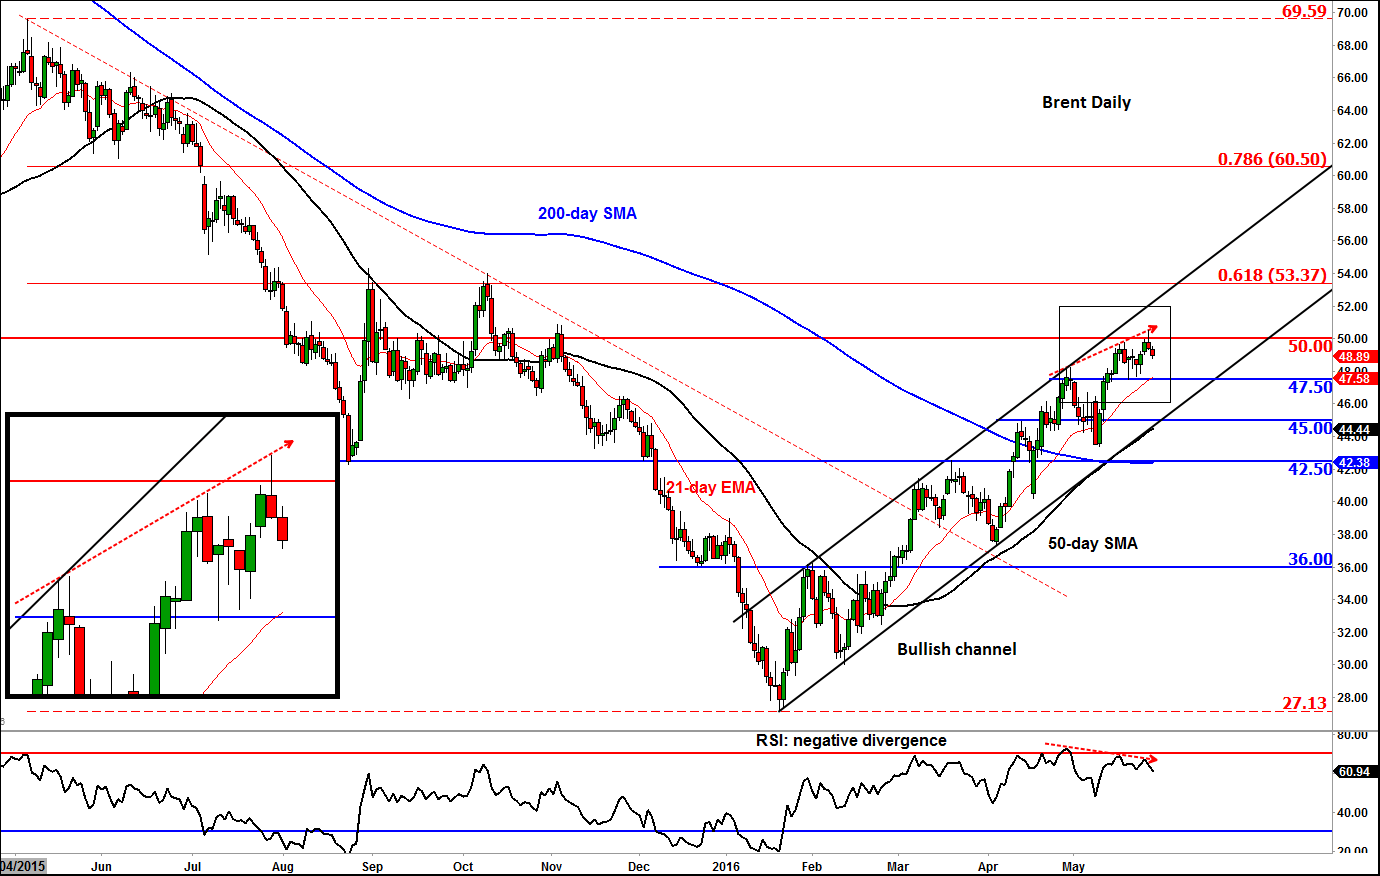
Ahead of next week’s key macro events, oil will prices will likely consolidate around the psychologically-important $50 a barrel, which is not a bad thing as far as the bullish case is concerned. But if oil prices form a base around and rise back above $50 in a bullish manner then this in turn could lead to further momentum buying interest next week. For Brent, the next potential resistance levels above $50 are around $52, the top of its bullish channel, followed by $53.35, the 61.8% Fibonacci retracement against the May 2015 high. WTI meanwhile has already surpassed the corresponding Fibonacci level, so the next retracement level to watch, should we get there, is the 78.6% at $54.75. Ahead of this level, WTI will still need to clear the $50.00-$50.90 resistance range first and the top of its bullish channel second.
Among the support levels to watch for oil, $48.90 is an important level on WTI as it corresponds with a short-term bullish trend line and prior highs. Below here, there is another short term trend line at around $48. The key support is in the $46-$47 range, where the lower trend of the bullish channel meets the previous resistance-turned-support level and the 21-day exponential moving average. The key support for Brent oil is at $47.50. The bears would do very well to push price below this level, given the current strong bullish trend.
Meanwhile the momentum indicator RSI on the daily charts still show negative divergence with price on both oil contracts. This on its own is not a bearish signal but a warning sign for the bulls who are chasing near the highs. If a top were to be found here, prices will chop around for a while, which could be uncomfortable for breakout traders. The strategy of fading the dips is still evidently the trade that works. The bears need to be patient, nimble and very selective as oil prices could easily go a lot higher before making a U-turn.