Crude oil gushes lower
More than ever the OPEC needed a clear strategy to help shore up oil prices on Friday. But failing to even agree on an oil […]
More than ever the OPEC needed a clear strategy to help shore up oil prices on Friday. But failing to even agree on an oil […]
More than ever the OPEC needed a clear strategy to help shore up oil prices on Friday. But failing to even agree on an oil production ceiling, not only does this mean that the global supply glut will remain in place for a lot longer than expected, but it also brings into question the organization’s role as a cartel. Oil producing nations and companies will therefore continue to do what is in their own best interest and produce as much oil as possible in order to stay in the game and avoid losing market share. Eventually, some of the weaker producers will go out of business. This, combined with industry consolidation and stronger demand, means we are getting closer to a bottom for oil prices. But this could take at least several months as shale producers are still surprisingly resilient. In the short-term, the excessive surplus will continue to exert heavy pressure on prices, which should help to keep the potential gains in check.
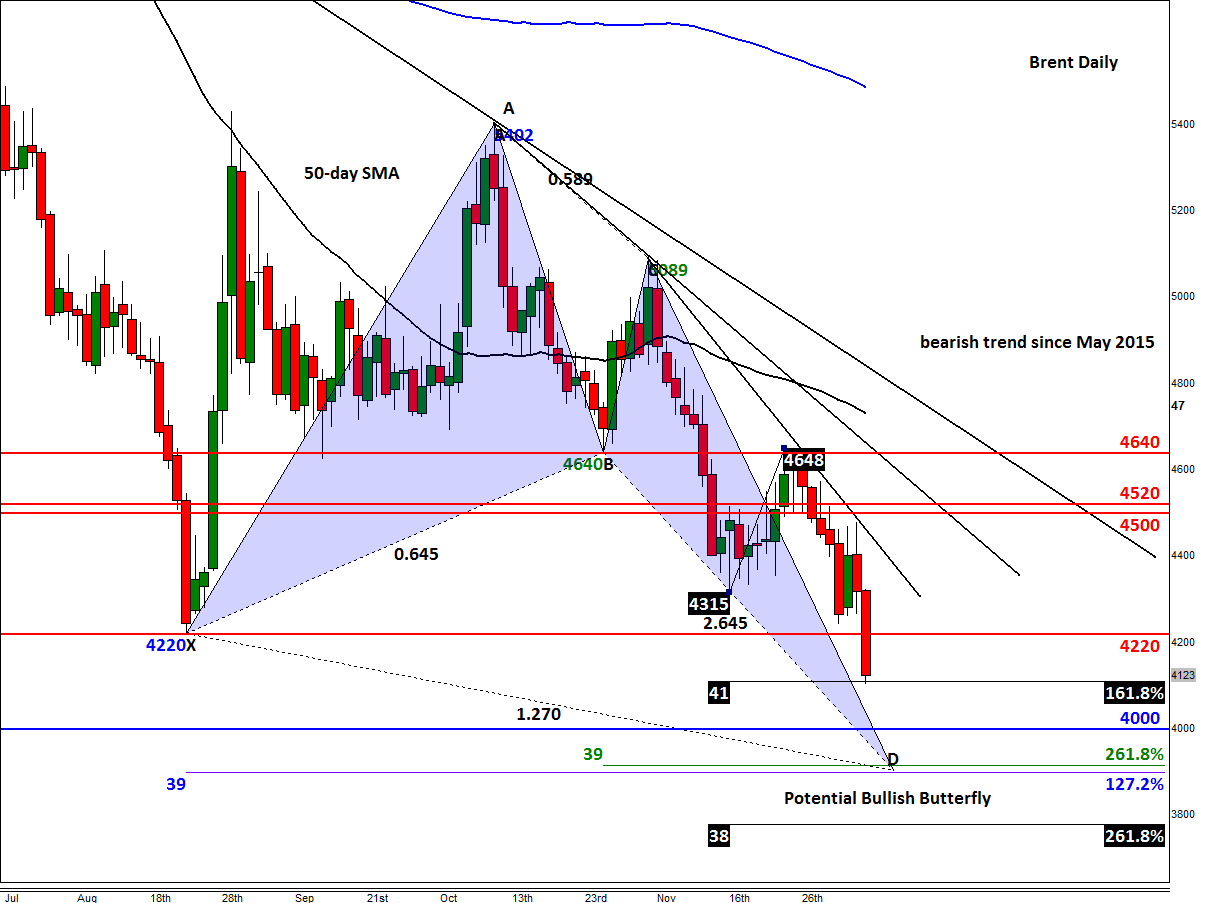
At the time of this writing, Brent oil was finding itself at just shy of $41 a barrel, a fresh multi-year low. Here, it was testing the 161.8% Fibonacci extension level of its most recent upswing. Thus, we may see some profit-taking around this exhaustion point, which could lead to a bounce of some sort. If Brent does find support here, or at another level lower, it could eventually rise to test the broken support – now resistance – at $42.20. Failure to bounce $41 however would expose the psychologically-important $40 handle for a test. If this level also breaks down, Brent may then drop to the Fibonacci converges area around $39.00 before potentially bouncing from there as the shorts take profit. The $39.00 level is also the extended point D of an AB=CD move, so it represents a Bullish Butterfly pattern, which can sometimes pin-point the exact top, and in this case, bottom. A potentially bullish outcome for Brent would be if it rallies from these levels and end today’s session back above $42.20 and thereby create a false breakdown signal. If this admittedly unlikely scenario happens, we may then see a significant bounce in the following days, particularly because of the extreme negative sentiment at the moment.
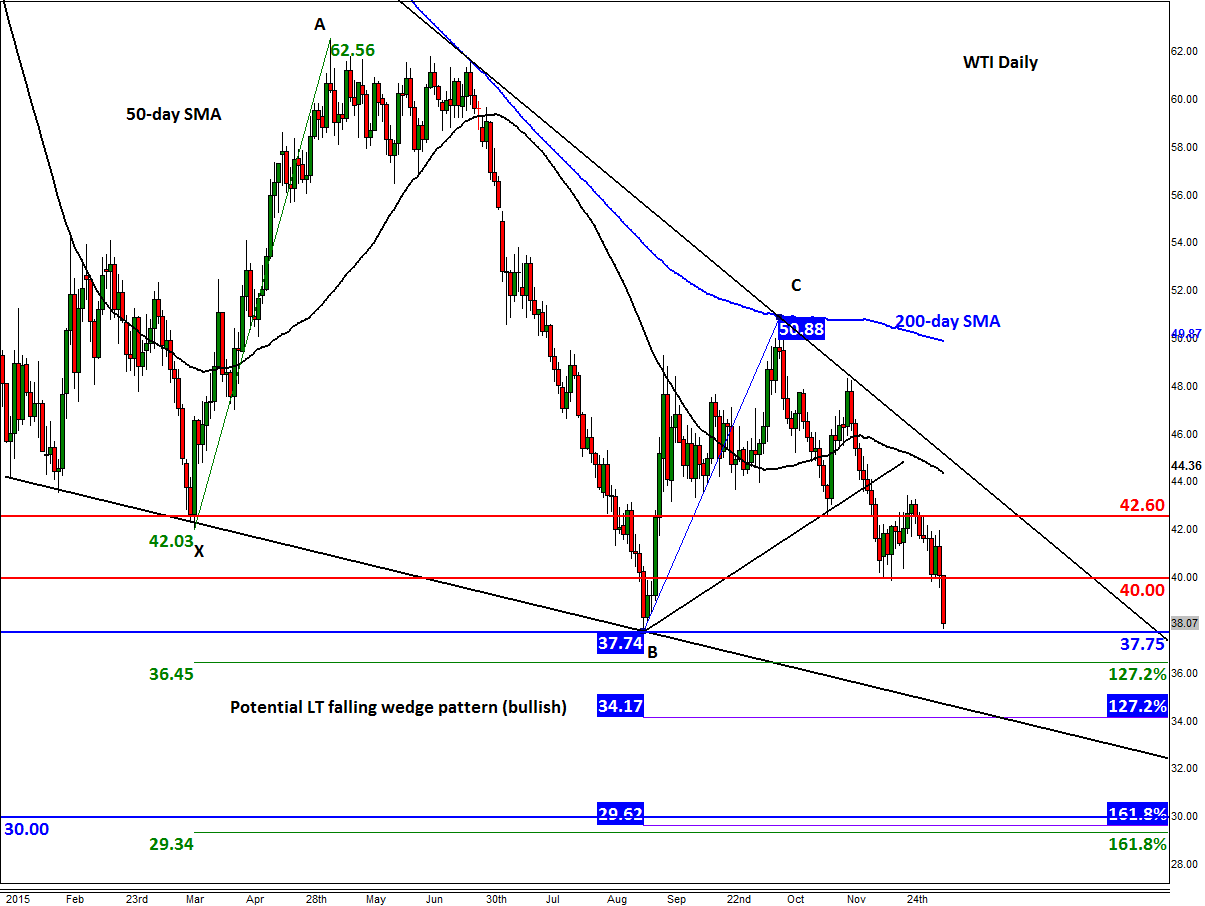
WTI meanwhile could follow Brent and break its earlier 2015 low of around $37.75 today or in the coming days. At the time of this writing, the US oil contract was just 25 cents away from this level, so it wasn’t looking great for the bulls. The Fibonacci extension levels from the previous price swings are shown on the chart. These would be among the possible support levels to watch. In addition, there is a potential falling wedge pattern in the making; the support trend of this formation needs to be watched closely around $34 a barrel. The key resistance for WTI is the old support at $40. The near-term bias remains bearish while it holds below here on a closing basis.