Crude oil continuing to defy gravity
Crude oil prices have been consolidating inside narrow ranges over the past several trading days after wrong-footing many traders in the aftermath of the Russia-OPEC […]
Crude oil prices have been consolidating inside narrow ranges over the past several trading days after wrong-footing many traders in the aftermath of the Russia-OPEC […]
Crude oil prices have been consolidating inside narrow ranges over the past several trading days after wrong-footing many traders in the aftermath of the Russia-OPEC meeting last week. The outcome of that meeting was “supposed” to cause oil prices to collapse as after all many people had attributed the rally to an expected oil production freeze deal, which ultimately failed to materialise. The initial gap down last Monday made a lot of sense. But the manner in which prices then rallied and how well they have fared since has surprised many people, ourselves included. The fact that the oil market has shrugged off the latest bearish news thus comes as no surprise: Saudi Arabia is extending an oilfield which could result in the production of an additional 250,000 barrels of oil per day from June; Iran is apparently ramping up crude output more quickly than initially thought and Iraq is on course to produce a record amount of the stuff in May.
The ability of oil prices to dismiss bearish news as easily as they have strongly suggests that significantly higher – as opposed to significantly lower – levels can be reached in the coming weeks. It will be interesting to observe how oil prices will react to any positive news. If they rally on good news and refuse to drop on bad news then it would further confirm the bullish bias. This thesis could be put to the test if the latest US oil inventories data show a surprise drawdown. The focus is also going to be on the direction of the dollar because of Wednesday’s FOMC policy statement and the fact we will have some important economic data from the US, including the first quarter GDP estimate on Thursday.
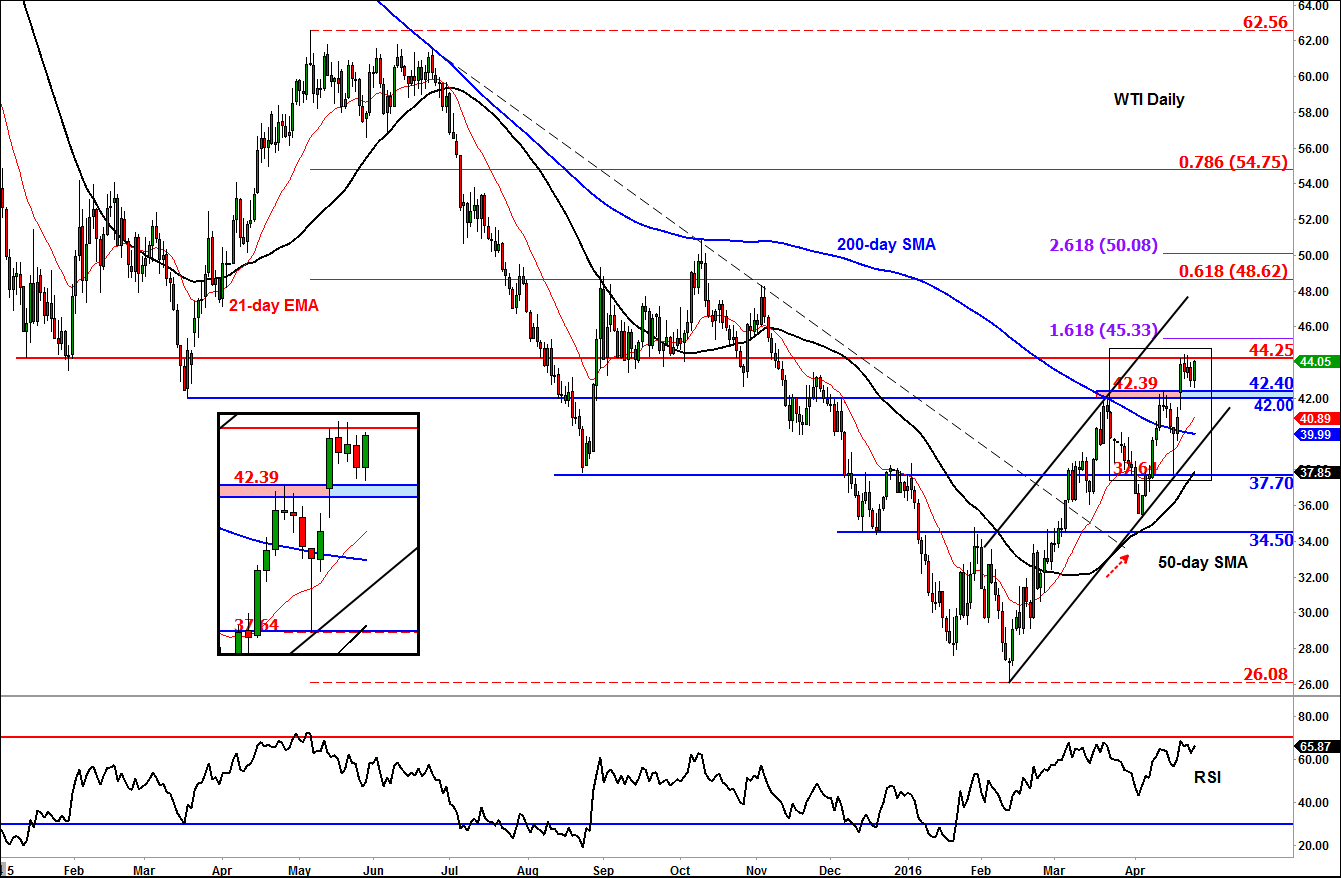
From a technical perspective, the hesitation of WTI between the key short-term support area of $42.00/42.40 and resistance level of $44.25/50 has allowed the RSI momentum indicator to unwind from “overbought” levels on smaller time frames without much price erosion. On the daily chart, the RSI has also eased off the 70 level slightly. Meanwhile, the 50-day moving average is closing in on the 200; a “golden crossover” looks imminent now for WTI. If seen, the golden cross would confirm a change in the long-term trend and may encourage some more momentum traders to jump on the bandwagon.
But what happens next will be determined by the direction of the break out from the aforementioned range between $44.00/40 and $44.25/50. If the breakout is to the upside, which looks more likely, then the bulls may aim for the 161.8% Fibonacci extension level of the most recent drop at $45.30/5 area as their next target. Thereafter, not much reference points are seen until the 61.8% Fibonacci retracement level of the drop from May last year, at $48.60. Alternatively, if the break out is to the downside, then WTI may drop to test its 200-day moving average and the support trend of the bullish channel at around $40 next.