Crude oil breakout to new highs may be due for pullback
The past five trading days of solid gains in crude oil prices have been based in part upon unforeseen global events that have given bulls […]
The past five trading days of solid gains in crude oil prices have been based in part upon unforeseen global events that have given bulls […]
The past five trading days of solid gains in crude oil prices have been based in part upon unforeseen global events that have given bulls some hope that the long-prevailing oil oversupply situation might actually begin to be alleviated. These events have included unfortunate incidences, including the wildfires in Canada that have posed a major disruption to Canadian crude production, and have been further intensified by general slowdowns in output from several oil producers, most notably the US, due primarily to the prolonged recent period of depressed crude oil prices.
Last week, the US Energy Information Administration (EIA) reported an unexpectedly large decrease (-3.4 million barrels) in US crude oil inventories. This week, the EIA’s report scheduled for Wednesday is also expected to show a similarly large draw in US crude stocks.
Also contributing to the recent recovery in oil prices is a demand picture that is showing signs of continued improvement. The International Energy Agency last week raised its global oil demand forecast for 2016 to 1.2 million barrels per day.
Despite this apparent upturn in both the supply and demand landscapes, however, the fact remains that many other major oil-producers, particularly some OPEC member nations, are both well-equipped and very willing to raise output in order to cover any shortfall in supply from their lagging counterparts. In fact, slowing global production is an ideal situation for producers like Saudi Arabia, as it allows these countries to increase market share in an environment where prices are still relatively well-supported by falling production from others.
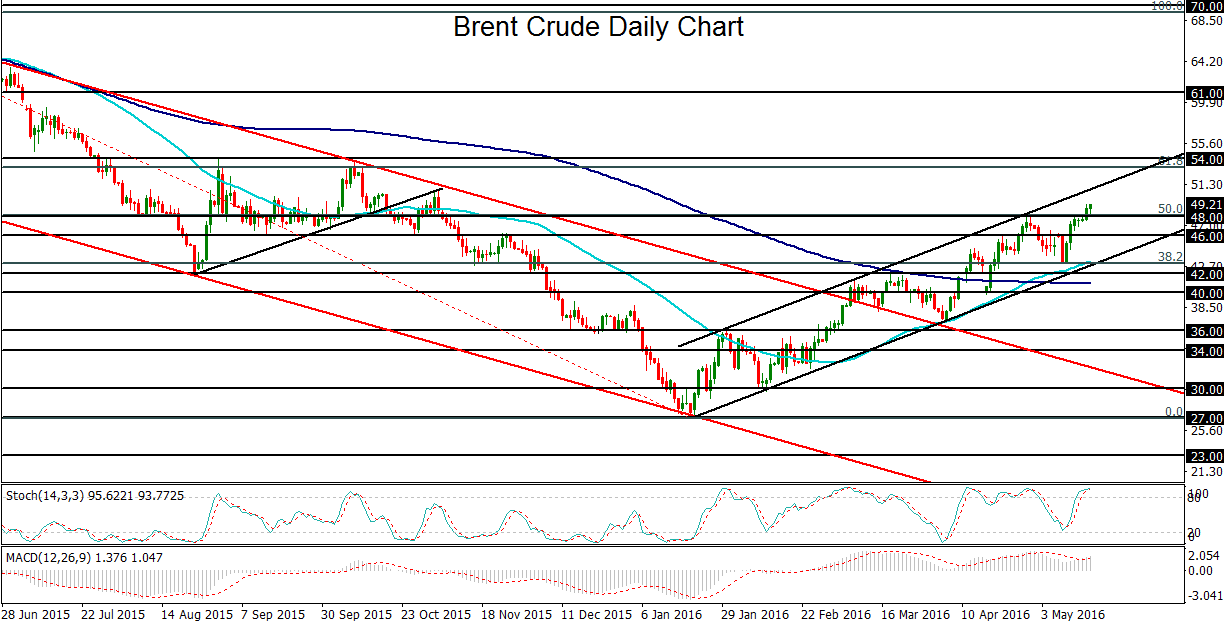
In the case of the Brent crude oil benchmark, price has been rising in a well-defined parallel uptrend channel since its $27-area lows back in January. Further highlighting this recent uptrend, Brent’s 50-day moving average formed a technical “golden cross” in late April by moving above its 200-day moving average, suggesting continued bullish momentum. Most recently, this uptrend broke out above major $48 resistance early this week. This $48 resistance level also represented the 50% Fibonacci retracement of the prolonged slide from the $70-area highs in May of last year down to the noted January lows around $27. Price has since followed-through to establish a new 6-month high above $49 as of Tuesday.
From a technical perspective, the breakout this week, if sustained, has opened the way towards the next major upside target at the key $54 resistance level, last approached in October of last year. However, after the most recent surge in crude oil prices, Brent is in technically overbought territory and could well be due for a potentially sharp pullback. This could especially be the case as supply-disrupting events abate and some major oil-producing nations continue to increase production to gain market share. In the event of a sustained price move back below $48, the next major downside target on a pullback for Brent is at the key $43 support level.