


September 14, 2021 12:32 PM
CPI data misses. Does it matter?
Inflation has been running hot this summer. Despite the high readings, Fed Governor Jerome Powell had declared that most of the inflation we have seen over the last 6 months was transitory. However, many traders and investors disagreed, and felt the Fed is “behind the curve”. At the Jackson Hole Symposium in late August, Powell finally conceded and admitted that the criteria for inflation goals has been met which would allow the Fed to taper. However, employment still has much ground to cover.
There was a lot of fanfare heading into today’s CPI data for August. The headline MoM print was 0.1% vs 0.3% expected. This dropped the YoY number from 5.4% to 5.3%. In addition, the core inflation rate was 0.3% vs 0.4% expected. This dropped the YoY core rate from 4.3% to 4.0%. Although the readings were lower than expectations, a 5.3% headline number is still way above the Fed’s target of 2%. Therefore, after Powell’s comments regarding inflation at Jackson Hole, does it really matter that the YoY print was 5.3% vs 5.4% last? This print should have no effect on the FOMC’s decision next week as to whether they will announce tapering. Inflation is high, everyone knows that. The Fed is now focused on the progress of their goals for maximum employment.
Everything you need to know about the Federal Reserve
The US Dollar Index sold off and stocks went bid immediately following the worse than expected MoM inflation data. However, on the stock market opening one hour later, they smartly reversed. One should consider that traders may have been taking advantage of better levels to exit positions. On a 240-minute timeframe of the S&P 500, price has pulled back to the 50% retracement of the move from the lows of August 19th to the highs of September 3rd, near 4451.8. The next support area is 4420/4428, which is the 61.8% Fibonacci retracement level from the same timeframe as well as horizontal support. Below there, price can fall to 4352.6! Intraday resistance is at 4461 and today’s highs of 4489. (Note that this is the cash S&P 500 Index, not the widely followed futures contract.)
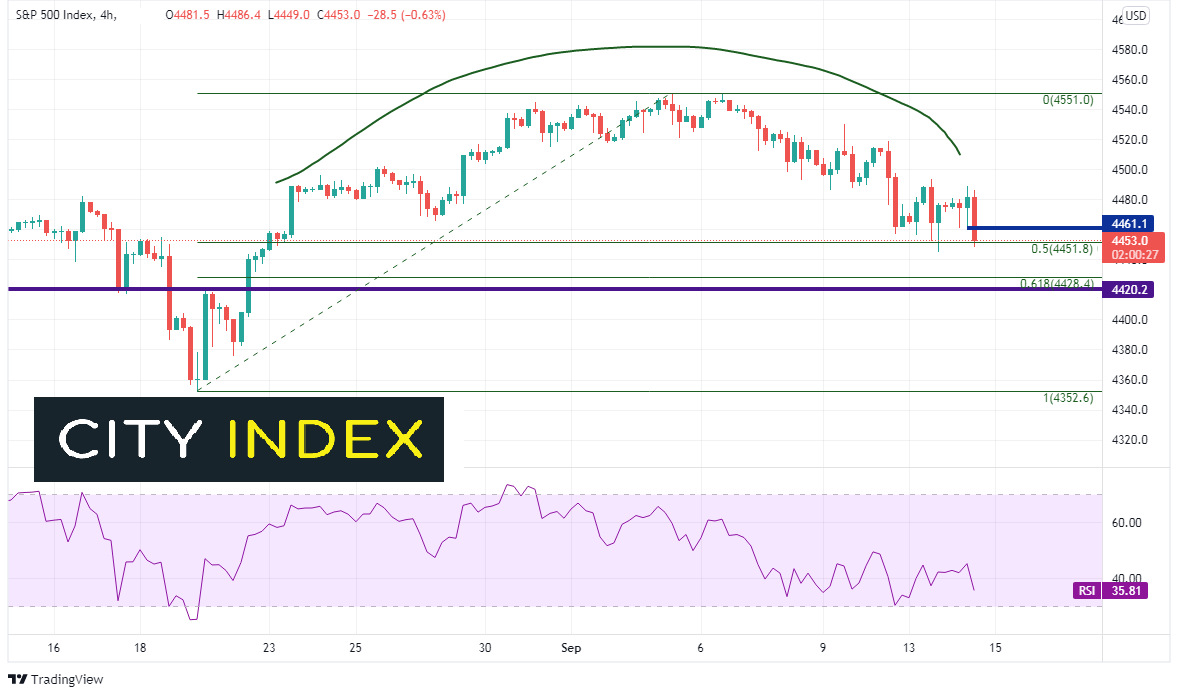
Source: Tradingview, Stone X
Trade the S&P 500 now: Login or Open a new account!
• Open an account in the UK
• Open an account in Australia
• Open an account in Singapore
On a 240-minute chart of the US Dollar Index (DXY), price fell to horizontal support near 92.31 and bounced. The possible inverted head and shoulders pattern is still intact, as there would be a double right shoulder. A close about resistance near 92.80 would confirm the pattern, with a target near the highs of August 20th, near 93.70. Support is at today's low and horizontal support near 92.31 and then the lows of the pattern near 91.95. Resistance is at the neckline near 92.80.
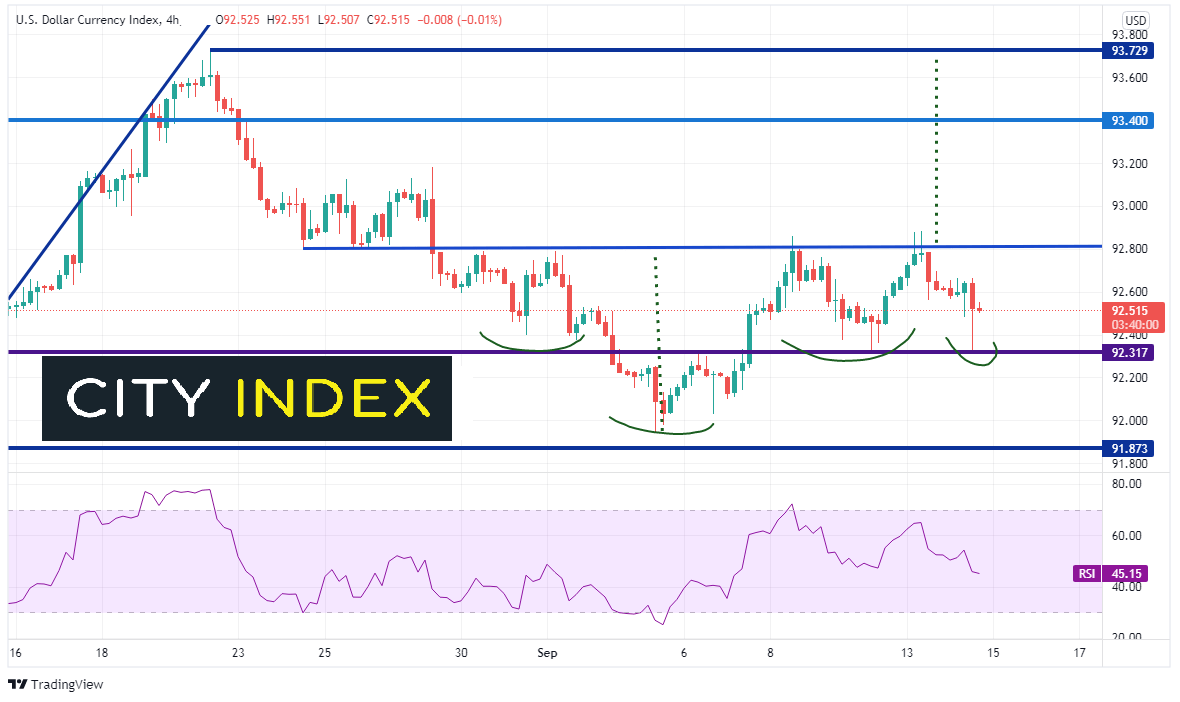
Source: Tradingview, Stone X
Although today’s inflation readings missed estimates, they are likely to matter little to the FOMC when they meet next week. Inflation goals have already been achieved according to Fed Governor Powell. The focus of the markets now should be on employment data!
Learn more about forex trading opportunities.
Latest market news
Yesterday 08:33 AM
Latest DXY articles
April 10, 2024 11:24 PM
April 8, 2024 03:35 AM
April 4, 2024 10:28 PM
April 3, 2024 02:35 AM