


April 13, 2021 11:08 AM
CPI data: Buy the Rumor, Sell the Fact: DXY, EUR/USD
The US March CPI headline YoY print was 2.6% vs 1.7% in February. 2.5% was expected. While it is true that March’s print is much stronger, the YoY data is distorted. Recall that between March and May last year, businesses were closing their doors and lockdowns were in place for much of the US. The CPI prints were dismal. That data has skewed the YoY print and is one of the main reasons the Fed says that the data is “hard to read” or that it is “transitory”. The core CPI YoY print was not as dramatic, coming in at 1.6% vs 1.3% in February and 1.5% expected. The headline MoM print was also slightly higher at 0.6% vs 0.4% in February and 0.5% expected.
Traders read right through the seemingly dramatic jump in the consumer price index. One could expect that a reading such as this would send stocks lower, with yields and the US Dollar moving higher. However, economists telegraphed the number well in advance. Therefore, traders reacted in a “buy the rumor, sell the fact” manner. The US Dollar Index (DXY) moved from 92.26 down to 92.03 within the first 15 minutes after the print.
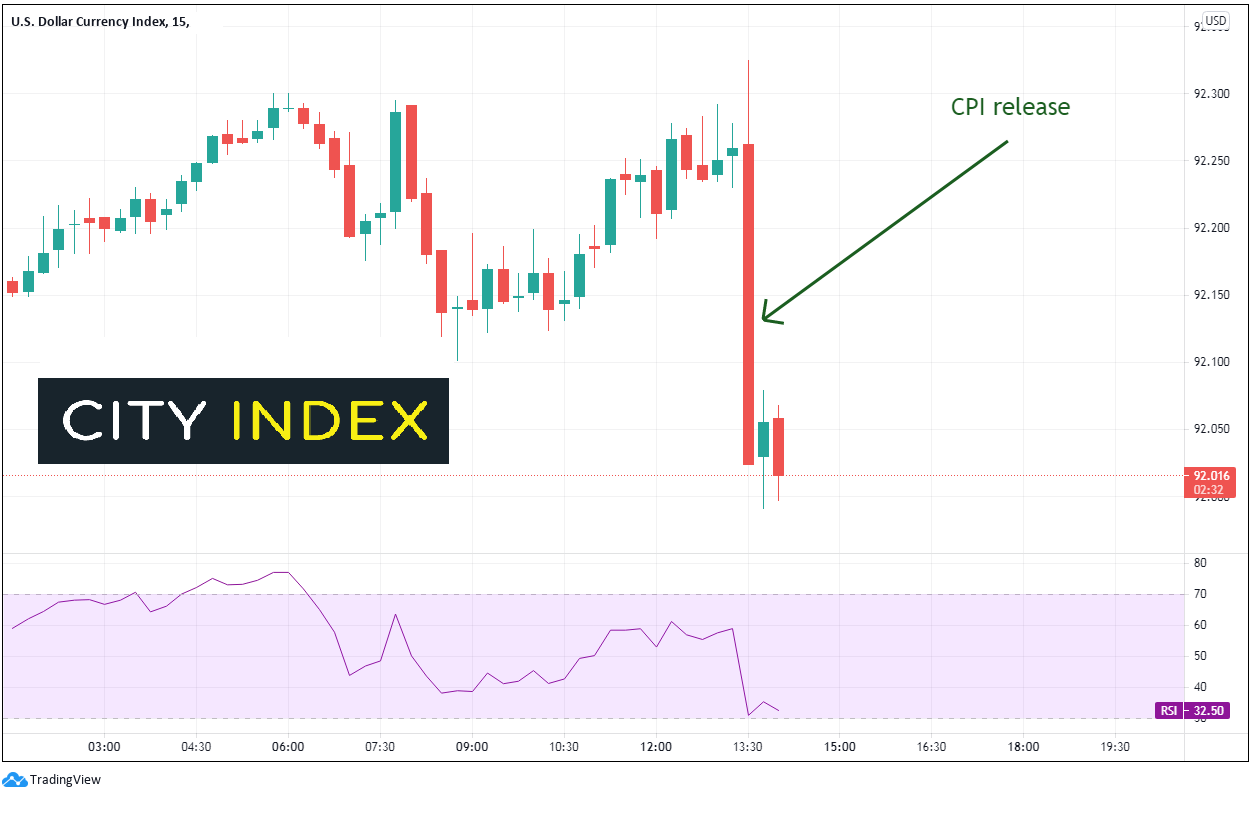
Source: Tradingview, City Index
The selling was too much for buyers to overcome at the 38.2% Fibonacci retracement from the February 25th lows to the March 31st highs, as well as horizontal support. A close above 92.00 would still give bulls hope for a move higher on a daily timeframe. The 50% retracement from the same timeframe is first support at 91.57. Resistance is near the 200 Day Average and today’s highs near 92.30. March 18th lows and the top of a large band of support is the next level of support near 91.30.
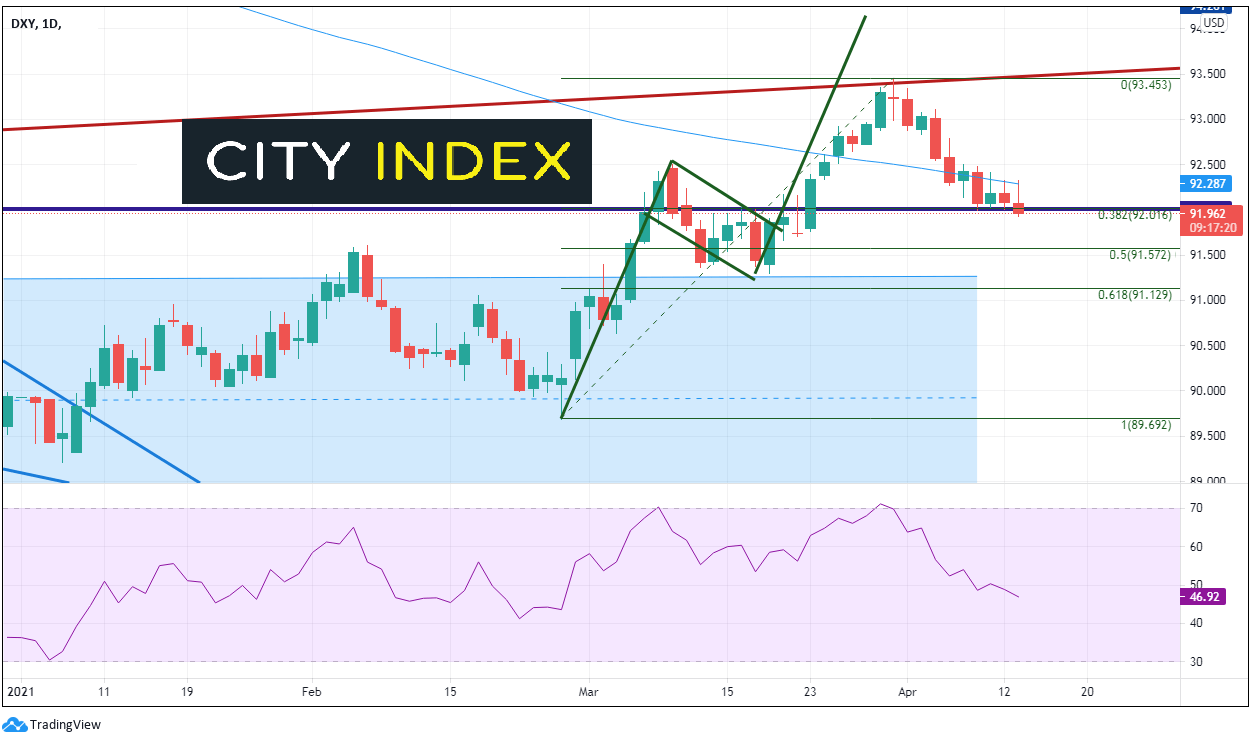
Source: Tradingview, City Index
As one may suspect, with the DXY moving lower, EUR/USD has moved higher. Within 15 minutes of the data, EUR/USD moved from 1.1894 to 1.1927.
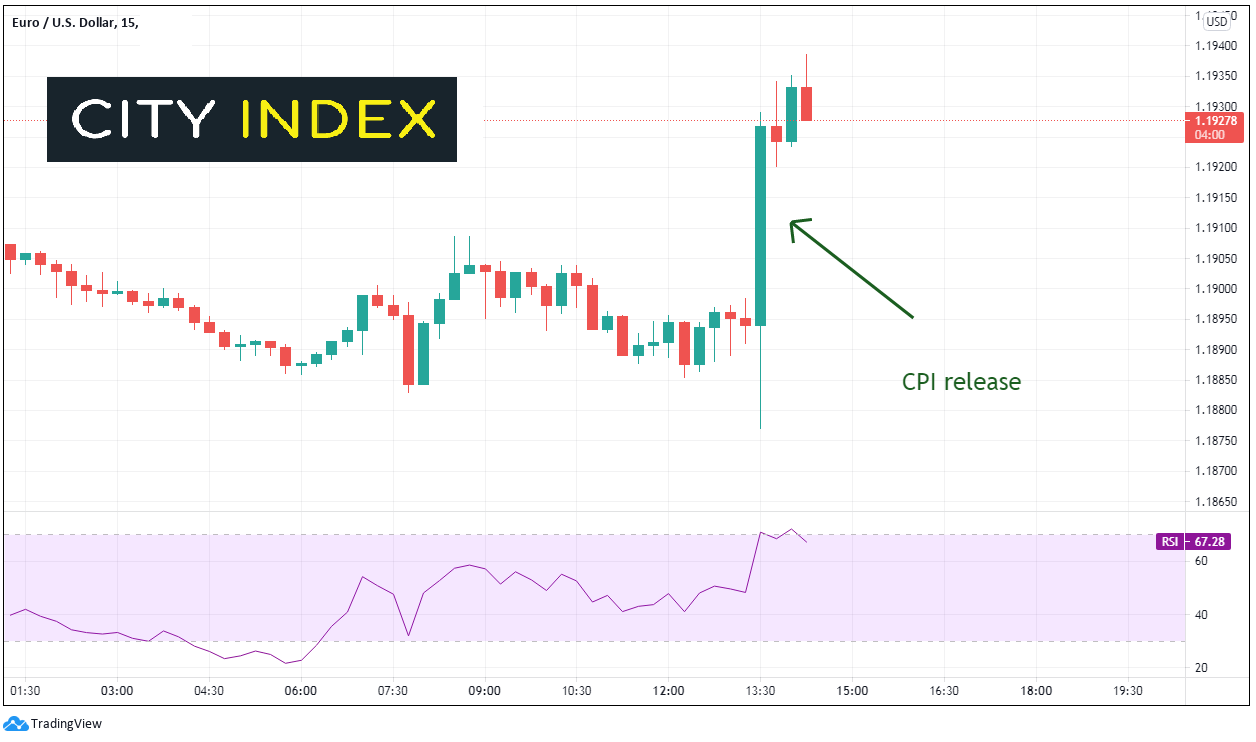
Source: Tradingview, City Index
On the move higher, EUR/USD pushed to its highest level since March 23rd. It has moved above the 38.2% Fibonacci retracement level from the February 25th highs to the March 31st lows at 1.1908 horizontal resistance. The next level of resistance is at the 50% retracement level from the same timeframe, near 1.1970, and then March 18th highs of 1.1989. Support below is at the 200 Day Moving Average and todays lows between 1.1876 and 1.1893.
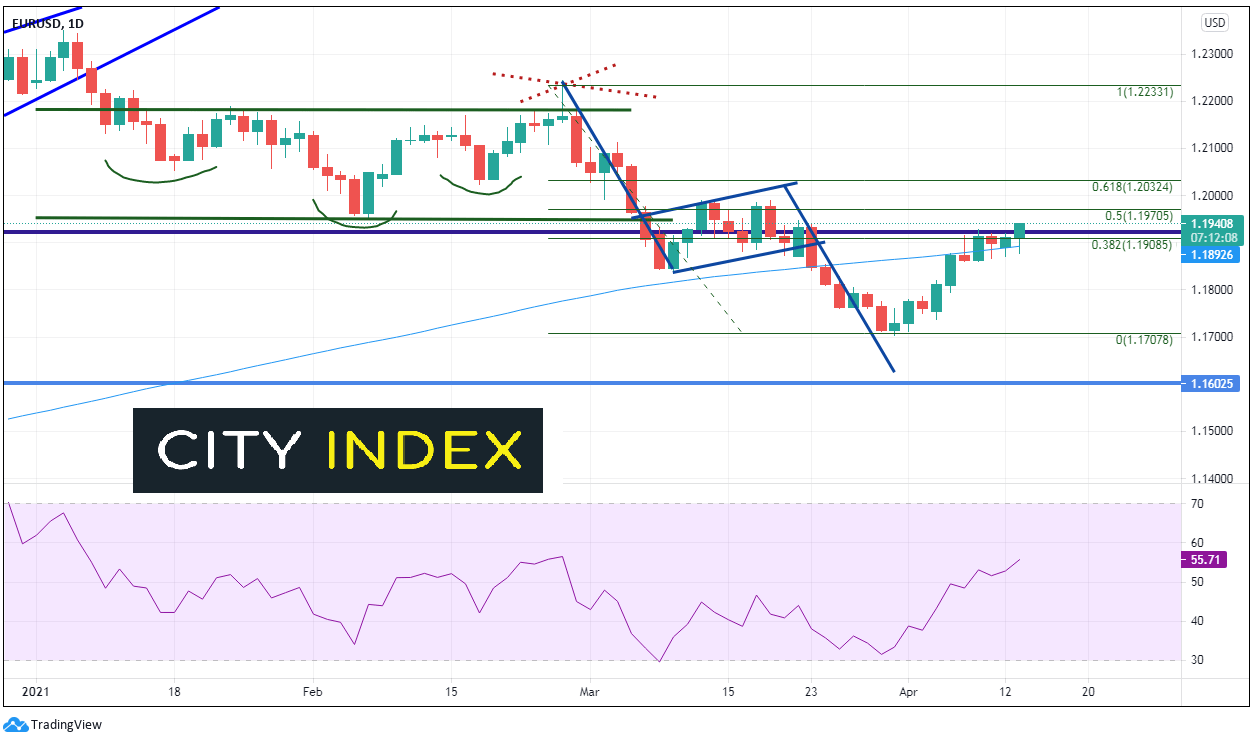
Source: Tradingview, City Index
The jump in headline CPI was dramatic, no mistake about it. However, it was expected well in advance due to distortions from the pandemic data 1 year ago. Expect many of the upcoming YoY data prints to be similar. But these numbers will be expected well in advance, don’t get caught on the wrong side of that line!
Learn more about forex trading opportunities.
Latest market news
Latest Forex articles

April 17, 2024 02:40 PM
April 17, 2024 04:47 AM