Could stocks bounce back despite raised Brexit concerns
The rise in risk loathing is due to concerns about “Brexit” but stocks could bounce back if the Fed talks down the prospects of a July rate hike
The rise in risk loathing is due to concerns about “Brexit” but stocks could bounce back if the Fed talks down the prospects of a July rate hike
The global equity markets have endured a rough few sessions. Evidently, traders have been piling in on safe haven assets like gold and silver, yen and benchmark government bonds, causing their yields to fall to dangerously low levels. Yields on the 10-year German bunds have dropped below zero for the first time ever, while in Japan bonds with maturities up to 15 years yield zero or less. Among other things, the rise in risk loathing is due to concerns about the economic implications of a potential exit of the UK from the EU. In recent days, “Brexit” concerns have intensified with new opinion polls showing the “remain” camp’s lead narrow. Indeed, the probably of remain has fallen to just 55% from around 64% on Monday, according to betting odds from Betfair.
In addition to the Brexit vote, stocks have been dragged lower by the corresponding sell-off in the oil market amid concerns that prices may have gone too far, too fast. But the selling in the oil market has slowed down a touch ahead of the weekly US inventories reports from the API (tonight) and EIA (Wednesday). If oil prices manage to regain their poise, then so too will some commodity-linked stocks which should help to provide support to the wider markets. But oil and stock market investors will need a helping hand from the Fed on Wednesday. The US central bank has already hinted strongly that a rate rise this week will almost certainly won’t happen. If the Fed signals that a July hike is also not on the agenda then this could provide equities and oil – vis-à-vis a weaker dollar – some support.
Nasdaq 100 testing key support
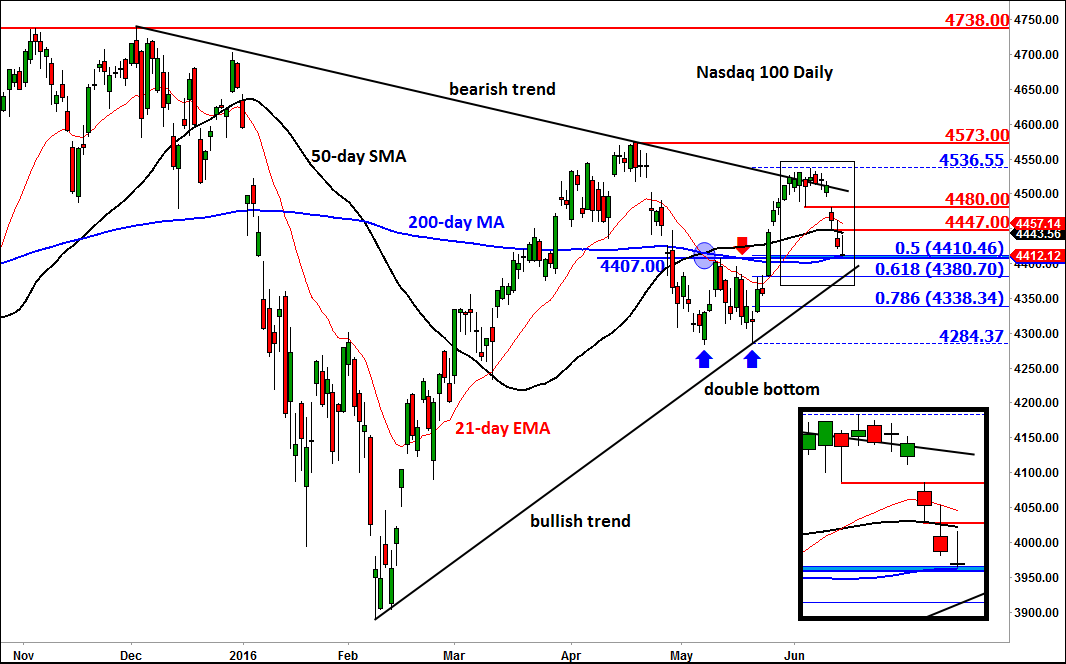
Among the major US indices, the Nasdaq 100 looks the more interesting one in that it is testing a key level of support today at around 4400/10. As can be seen from the chart, this is where the 200-day moving average converges with previous resistance and the 50% retracement level. With so many technical factors converging in close proximity here, there is a possibility for a nice rebound, especially given how “oversold” the short-term charts have become: the 1 and 4 hour RSI on almost all the major indices have either moved below or neared the oversold threshold of 30.
Should the Nasdaq 100 bounce back here, traders should then watch key levels such as 4445 (support-turned-resistance meets the 50-day SMA there) and 4480 (old support and resistance) for signs of resistance and another drop.
However if the Nasdaq 100 fails to find support at around the noted 4400/10 area then it may go on to test the bullish trend line at around 4380 next, which is also where the 61.8% Fibonacci come into play. It should be noted that if support fails to hold here then a more significant correction could be on the way.