


November 24, 2021 4:52 PM
Except for the Initial Claims data (+199,000, lowest since 1969), the data released this morning was weaker than expected with Durable Goods at -0.5% MoM vs +0.2% MoM expected and the 2nd look at Q3 GDP lowered to 2.1% QoQ from 2.2% QoQ at the preliminary reading. The PCE headline print of 5% YoY was hotter than expected as well. And the Fed’s favorite measure of inflation, Core PCE, came in at a blistering 4.1%. Remember, the Fed inflation target is 2%. Therefore, their favorite measure of inflation is more than double what they would like it to be. In addition, the 1-year inflation expectation from the Michigan Survey is 4.9% and the 5-year inflation expectation is 3%. Today’s data sums up Q3 to date: slower growth, better jobs, and higher inflation. The Fed has some work to do!
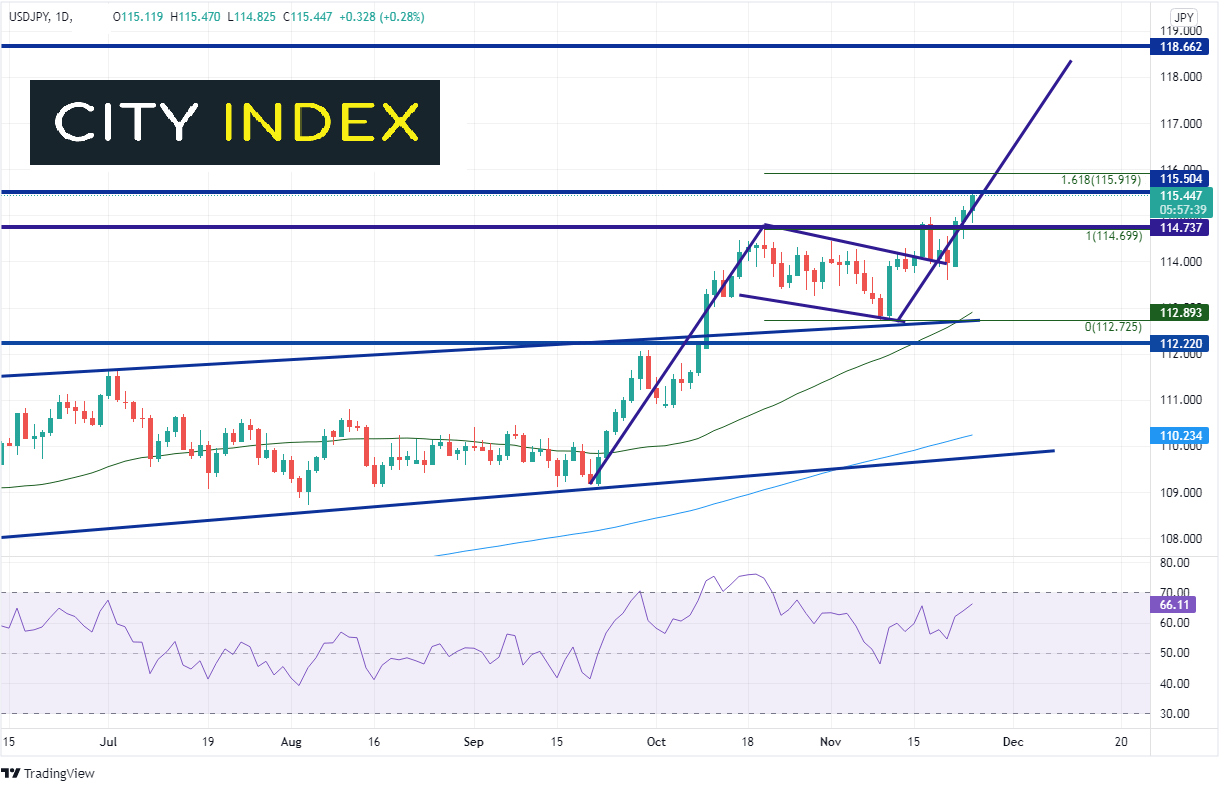
With expectations rising that the Fed needs to do something to slow down the pace in the rise of inflation, USD/JPY has been moving higher. We have had the flag pattern on the USD/JPY chart drawn out for a while. After breaking out on November 16th and heading to a high of 114.89, it appeared that a reversal candle the next day may negate the pattern. However, USD/JPY rode along the top trendline of the flag, and finally moved higher on Monday, moving above the November 16th highs! USD/JPY is trading at its highest levels since March 2017! Resistance from that same timeframe sits just above at 115.50. Above that is the 161.8% Fibonacci extension from the highs of October 20th to the lows of November 9th, at 115.92. The target for the flag pattern is the length of the flagpole added to the breakout point of the flag, at 118.37. This is just ahead of horizontal resistance at 118.62, which is the high from December 2016. Support is at the flag high of 114.74 and then the lows of November 19th at 113.58. Below there, price can fall to the bottom of the flag and November 9th lows at 112.725. (The 50 Day Moving Average is also at 112.89).
Source: Tradingview, Stone X
Trade USD/JPY now: Login or Open a new account!
• Open an account in the UK
• Open an account in Australia
• Open an account in Singapore
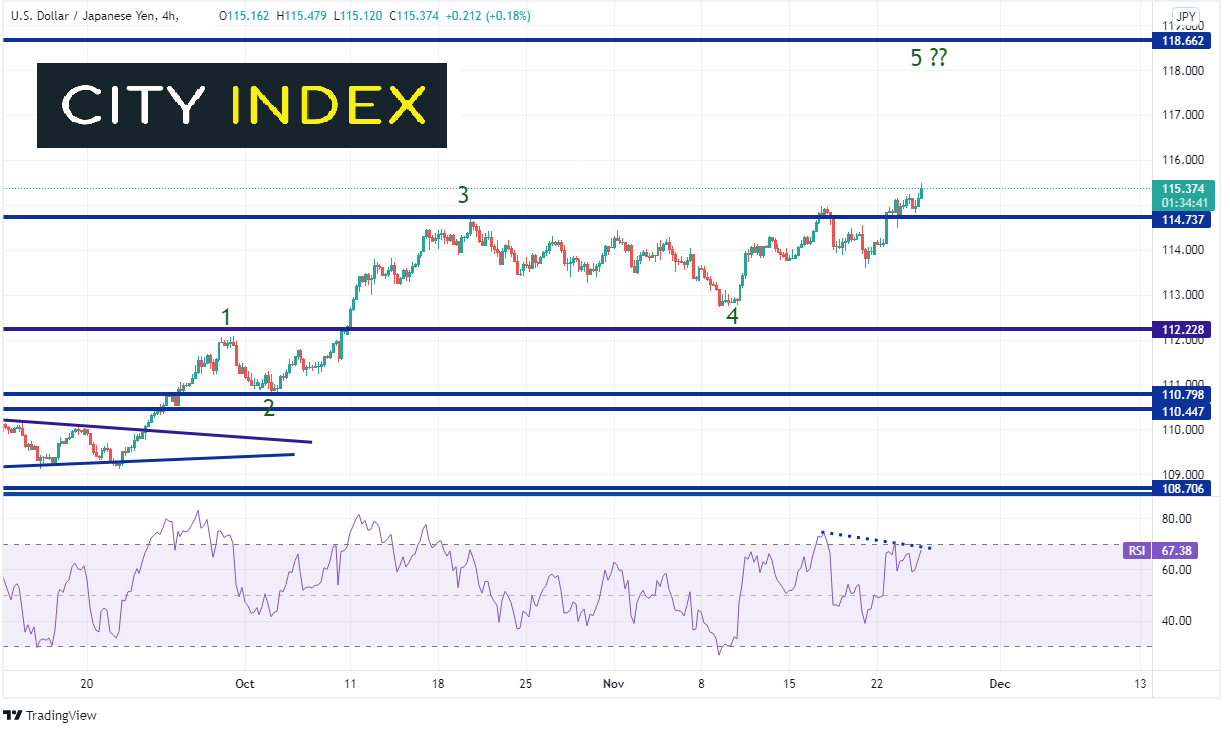
Note as well that on the 240-minute timeframe, we have had this Elliot Wave pattern drawn out since early November. Wave 4s tend to be messy. The Wave 4 below is a regular flat corrective wave, in which price moves in more of a sideways range, rather than a pullback. Price now has broken above the wave 4 highs and is on the move higher in Wave 5. Could the top be the flag target on the daily near 118.37?
Source: Tradingview, Stone X
The one economic piece that the markets are the mostly concerned about lately is inflation (more so than employment). As such, with the Fed’s favorite measure of inflation for October double what they are targeting, markets feel that something must be done (i.e. increase pace of tapering). USD/JPY does a good job of reflecting market sentiment for the direction of interest rates!
Learn more about forex trading opportunities.
Latest market news
Yesterday 11:48 PM
Yesterday 11:16 PM
Yesterday 05:00 PM
Yesterday 01:13 PM
Latest Trade Ideas articles
Yesterday 11:48 PM
Yesterday 11:16 PM
Yesterday 05:00 PM
Yesterday 11:00 AM