Copper Raises Questions
Copper, known as the PhD in Economics for its track record in foretelling economic growth is up 7% so far this year, well below the […]
Copper, known as the PhD in Economics for its track record in foretelling economic growth is up 7% so far this year, well below the […]
Copper, known as the PhD in Economics for its track record in foretelling economic growth is up 7% so far this year, well below the 16%, 15% and 8% attained by silver, platinum and gold respectively. But it has outperformed all grades of oil over the same period, yet not natural gas. Interestingly, copper’s YTD performance is almost equal to its 9% performance of the last six months, which is when it began robust recovery following a poor March-May performance. That period, coincided with escalating headwinds in Greece, weakening macro data from China and a broad erosion in commodities, coming to a head in May.
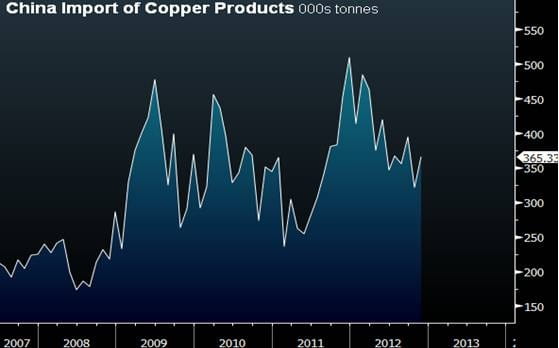
All eyes will be on China for copper’s next move. Slowing exports from weak foreign demand dragged overall GDP by 1%. Chinese investment has peaked at 50% of GDP, similar to the level by most large economist during peacetime. And despite rising Capex, its contribution to investments may not always rise if physical capital is so substantial in size. This may explain why the potential for faster growth is rather fragile–even in the case of a new stimulus package. The IMF forecast China to grow at a modest 8.2% in 2013, higher than the 7.8% projected for 2012, but well below the +10% average of the 2000s. Yet as China’s indicators appear to have stabilized, reports of a looming stimulus package have eased for now.
Whether the lack of a spending package was attributed to the uncertainty with regards to the next shift in political power, or simply a question of economic improvement remains to be seen. Yet China’s new (lower) growth trajectory is unlikely to reverse anytime soon, and copper may have to deal with a “New Chinese Normal”.
Chinese economists expect copper consumption grow at its slowest pace in 16 years. Even the copper giants are retrenching. Copper giants such as BHP and Rio Tinto expect long term price declines, while US-based Freeport-McMoran decided to venture into oil.
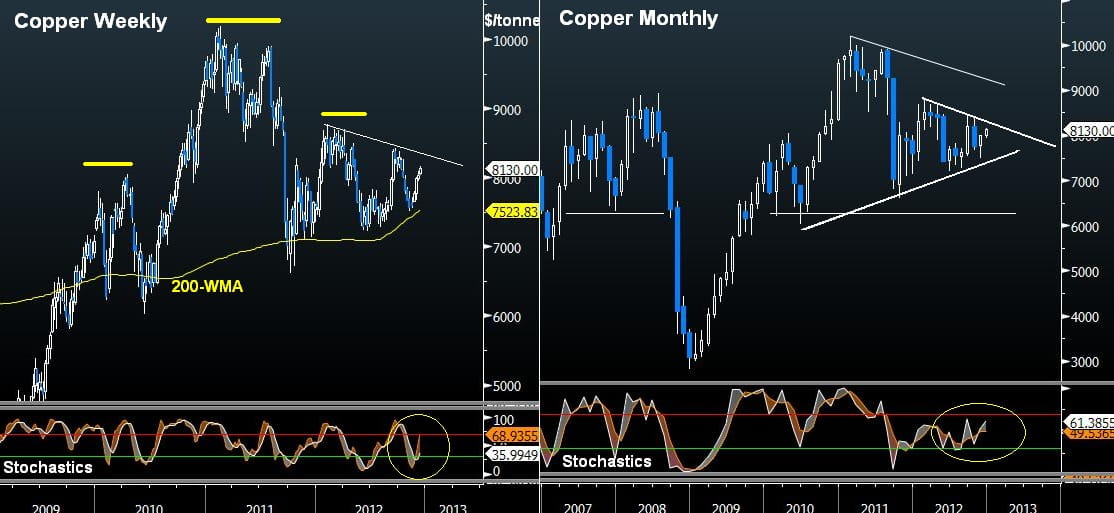
Copper’s technicals may appear to be showing a bearish Head and Shoulder formation, best seen on the weekly chart. A rising neckline may not be the most convincing component of this formation, neither the higher right shoulder. A rally and a monthly close above $8,800 would be required to shake off the thereat of the H&S formation. Yet, support appears to be holding firmly above the 200-week moving average, which served as a foundation since 2010.
Looking at oscillators is essential in helping you to avoid false breaks of key moving averages and trend lines. Thus, it is difficult to shrug the improving oscillators on the weekly (medium speed) chart, which could well argue for a bounce towards $8,350—the trendline resistance extending from the February high.
The monthly chart support highlight the 2 ½ year foundation, but once again the $8,350-50 territory emerges as the immediate resistance, coinciding with the 50% retracement of the decline from the February 2011 high. Failure to regain $8,300 by end of January would have negative implications for a potentially threatening wedge, which could trigger selling down to $7,300, followed by a break to $6,800.