


China data points to softer growth in Q4
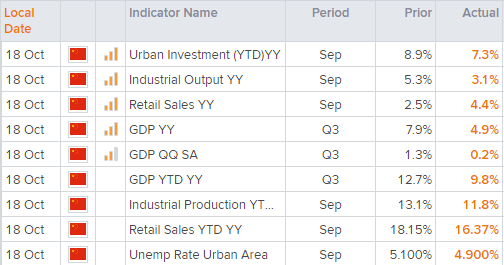
Growth was expected to soften anyway, but overall it was a disappointment relative to already-softened expectations. At 4.9% y/y, it is the first time that GDP has fallen below 5% since Q1 2020 as the global pandemic was truly underway. Expectations landed around 5.2%, down from 7.9%. Exports accounted for 19.5% of GDP and final consumption accounted for 64.8%. A spokesman from the stats bureau said that China is able to achieve full-year economic targets despite this setback.
Industrial production was also disappointing, coming in at 3.1% m/m compared to 3.9% expected and down from 5.3% in August. This dragged the annual rate down by 4.1 percentage points to 11.8%. Urban investments also fell for a 7th consecutive month to 7.3%. Retail sales bucked the trend and rose 4.4% in September up from 2.5% and beating estimates if around 3.3%.
Overall data today points towards softer growth for Q4. And this means traders will place extra emphasis on leading indicators such as the PMI’s which can provide a forward look at potential growth. And given manufacturing and services PMI’s dipped below 50 in August due to lockdowns, then we’d need to see them pick up from current levels to revive hopes of a positive Q4 GDP print. In September manufacturing was flat at 50 according to the Caixin read, although services expanded at 53.4 compared with 46.7 previously. The ‘official’ NBS read for manufacturing contracted at 49.6, so leading indicators are not yet pointing to a rebound for growth in Q4.
Equities feel the heat of soft data
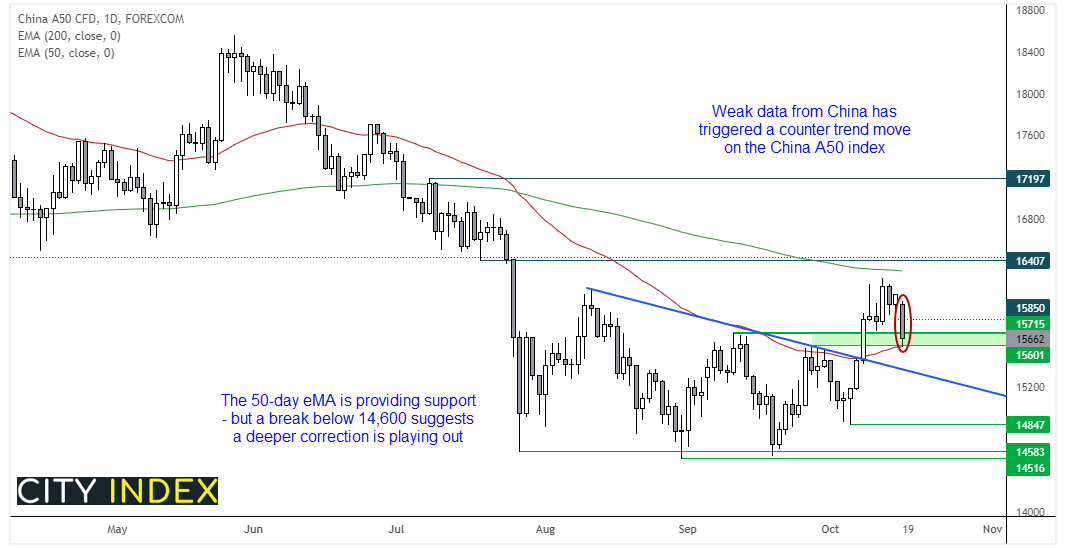
The soft data set took the wind out of the sails for investors. Heading into the data sentiment was buoyant, thanks to a strong finish on Wall Street and better than expected earnings reports. China’s equity markets are the weakest performer across the region with the CSI300 falling -1.5% after the open. The Hang Seng China Enterprise index (HSCE) is down around -1% and the Hang Seng is off by -0.7%. However, the China A50 index is the session’s worst performer and trades around -1.9% lower on the day.
The daily trend is now within a countertrend move after its rally from 14,847 stopped just shy of the 200-day eMA. It has fallen back to the 15,600 – 15,715 support zone highlighted in today’s Asian Open report, with the 50-day eMA providing support at the day’s low. If prices can stabilise around current levels then it may be able to form a corrective low, and a break above 15,850 brings the cycle high back into focus. Whilst a break beneath 15,600 warns of a deeper retracement, and we would look for support to build around the broken trendline. The daily trend remains bullish above the 14,847 low.
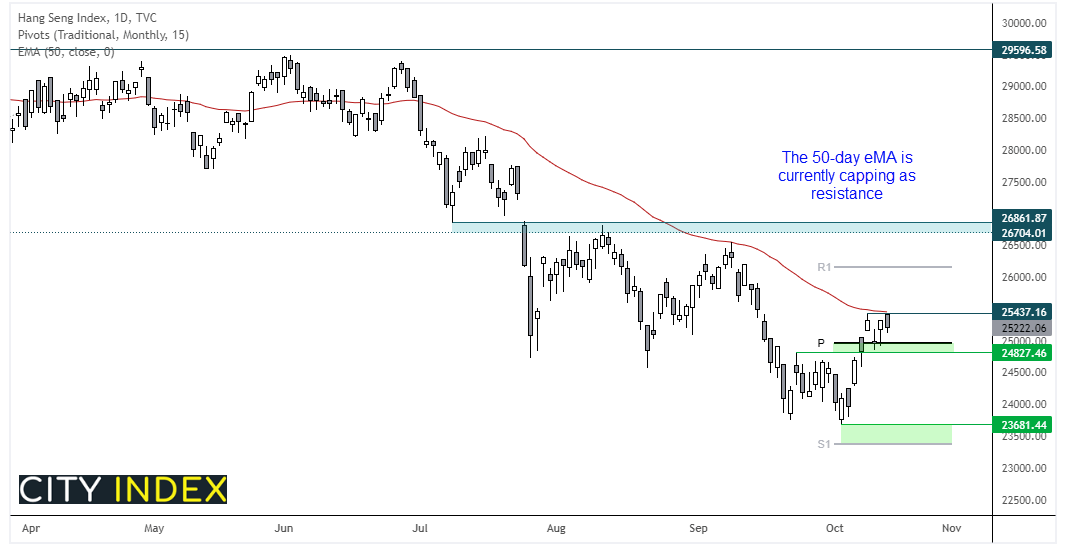
The Hang Seng is also interacting with its 50-day eMA, although it is currently capping as resistance. It has seen a strong rally from the October low but prices are now in a sideways range between 24,800 – 25,440. If prices retrace to the lower boundary of the zone then it may tempt dip-buyers who are anticipating a break above 25,500 as part of trend extension. Yet if prices break below 24,800 it suggests the market is either in a count trend move, or momentum has realigned with its longer-term bearish trend and could retest October’s low.
How to trade with City Index
You can trade easily trade with City Index by using these four easy steps:
-
Open an account, or log in if you’re already a customer
• Open an account in the UK
• Open an account in Australia
• Open an account in Singapore
- Search for the company you want to trade in our award-winning platform
- Choose your position and size, and your stop and limit levels
- Place the trade
Latest market news
Yesterday 08:33 AM
Latest Trade Ideas articles


Yesterday 06:20 AM