


October 31, 2019 11:11 AM
China-US Trade Talks Appear to have Hit a Snag
Phase One seems to be on course to be signed sometime within the next month. However, China said earlier today that they are doubtful of any long-term trade deal with US President Trump and that they are unwilling to budge on big structural changes. They also said that before any kind of Phase Two talks are to begin, the US must drop all tariffs. Stock markets initially sold off on the announcement, along with AUD/USD and NZD/USD, as both Australia and Canada are heavily dependent on China’s economy.
S&P 500 futures were hit in the overnight session, dropping from 3050, down to 3033.50. Stocks bounced since to horizontal resistance and the 78.6% Fibonacci retracement level at 3046.50, but have moved lower since, as the US Chicago PMI came out much weaker than expected. Currently, they are trading down 17 handles, however the rest of the day may slow down ahead of Non-Farm Payroll tomorrow morning.
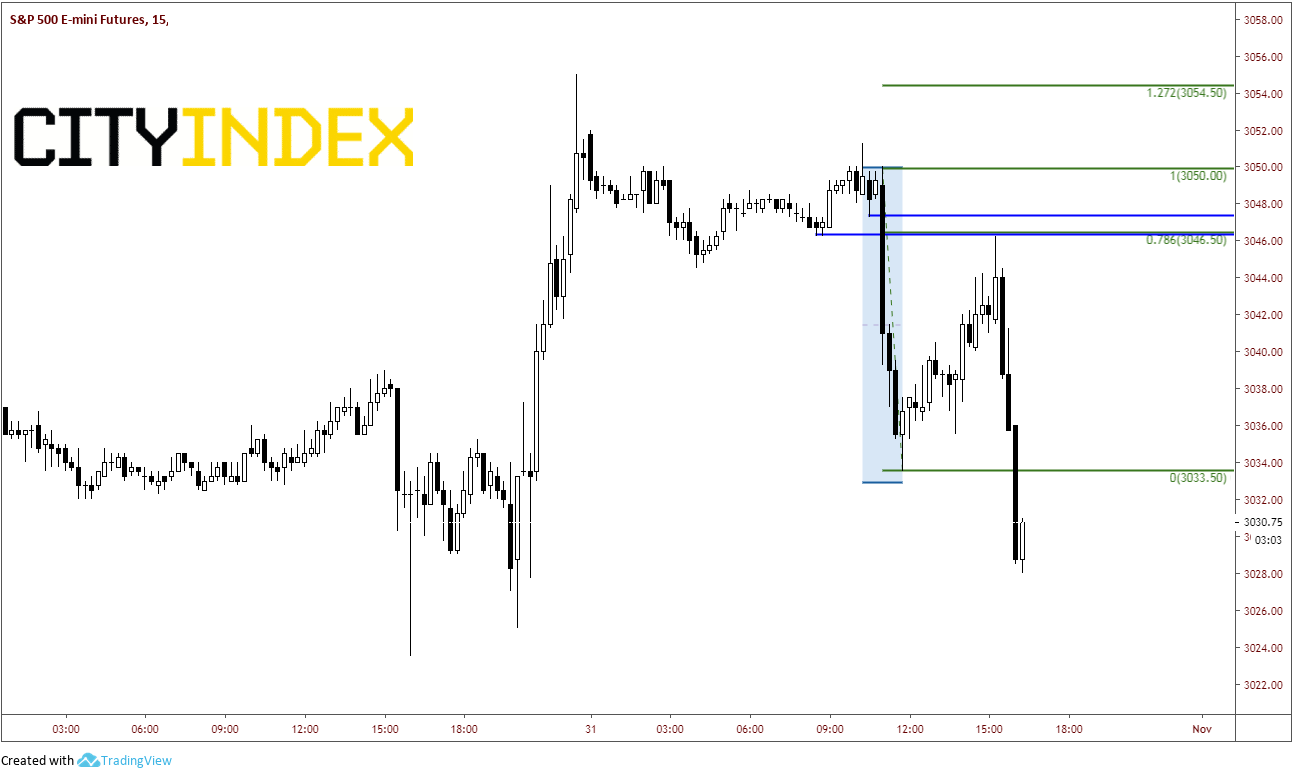
Source: Tradingview, CME, City Index
On a daily chart, one can clearly see the S&P 500 futures knocking on the long term upward sloping trendline, dating back to October 2018 at the all-time highs of 3055. If price breaks through there, it could head up to 3100, which is near the 161.8% Fibonacci extension level from the highs on May 1st to the lows on June 3rd. First support level is 3026.25, which is previous resistance (now acting as support).
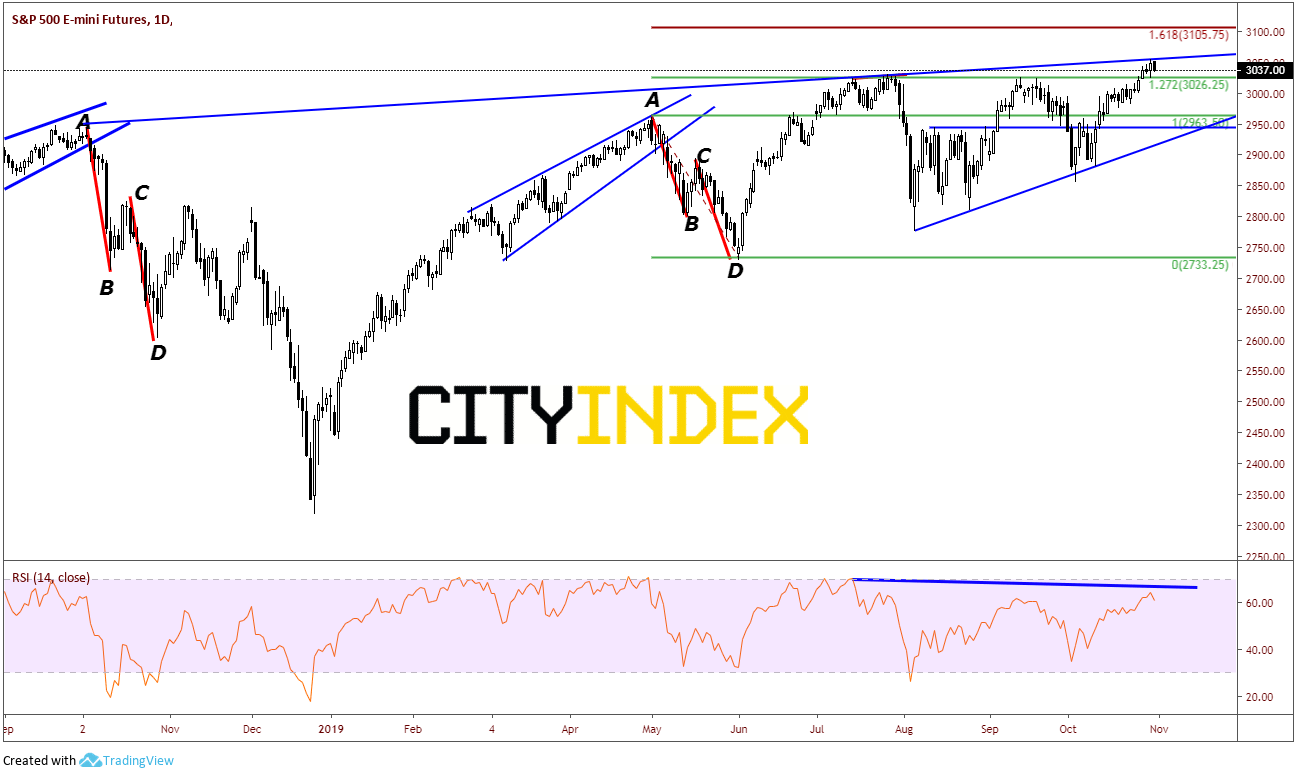
Source: Tradingview, CME, City Index
AUD/USD moved lower as well on the headlines, selling off from .6922 down to .6888. Just as the S&P’s have done, the pair has since bounced to horizontal resistance and the 78.6% Fibonacci retracement level at .6914. AUD/USD is currently trading with that range.
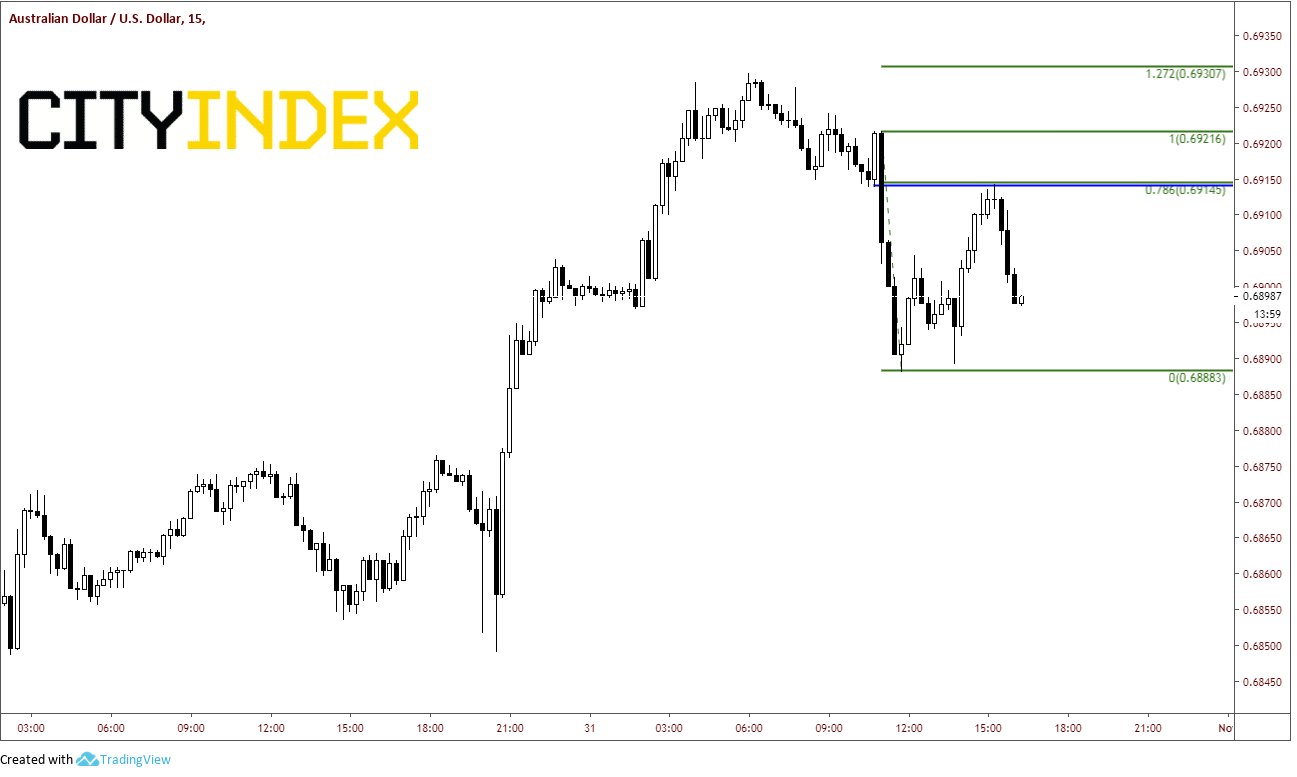
Source: Tradingview, City Index
On a daily chart, the candle is forming a shooting star, which is a reversal formation. Resistance above at today’s high of .6930 and the long term downward sloping trendline from November 2018 near .6950. Support now comes in at .6880. Below that, there is a support zone between .6809 and .6836. There is also a rising trendline from the October lows, which comes across near those same levels.
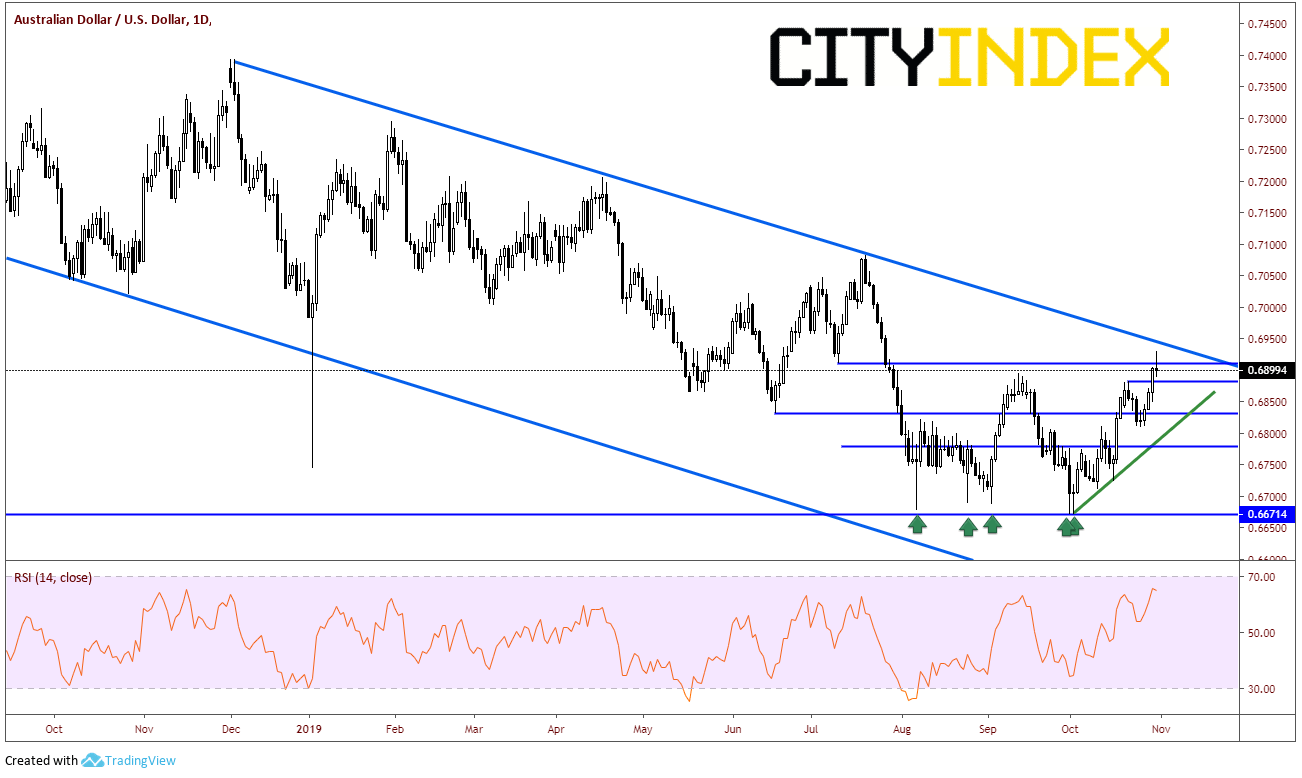
Source: Tradingview, City Index
NZD/USD also moved lower on the headlines, selling off from .6423 down to .6392. Interestingly, the pair then traded back up to the day’s high at .6432. Whereas the S&P500 and the AUD/USD only traded back to the 78% Fibonacci level, NZD/USD traded all the way back up to the 127.2% Fibonacci extension from the level below the selloff. NZD/USD is also currently trading within today’s range.
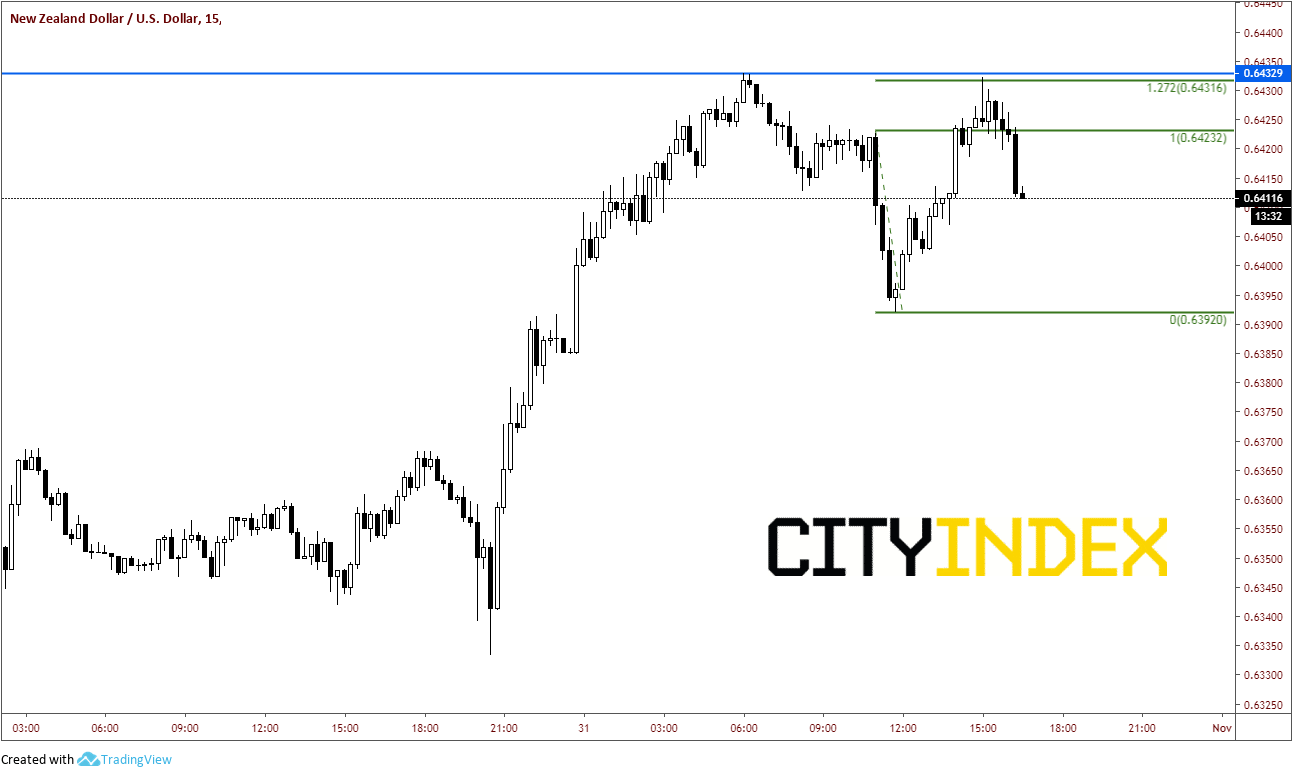
Source: Tradingview, City Index
On a daily chart, after breaking out and retesting the broken neckline or the inverted head and shoulders, the pair is pushing higher and trying to take out prior highs and the 38.2% retracement level from the highs on July 19th to the lows on September 30th at .6438. Resistance above there is horizontal resistance, the 50% Fibonacci retracement level from the previously mentioned time period and the target level on the inverted head and shoulders pattern. This level comes in between .6490 and .6500. Support is back down at the neckline and previous highs near .6338.
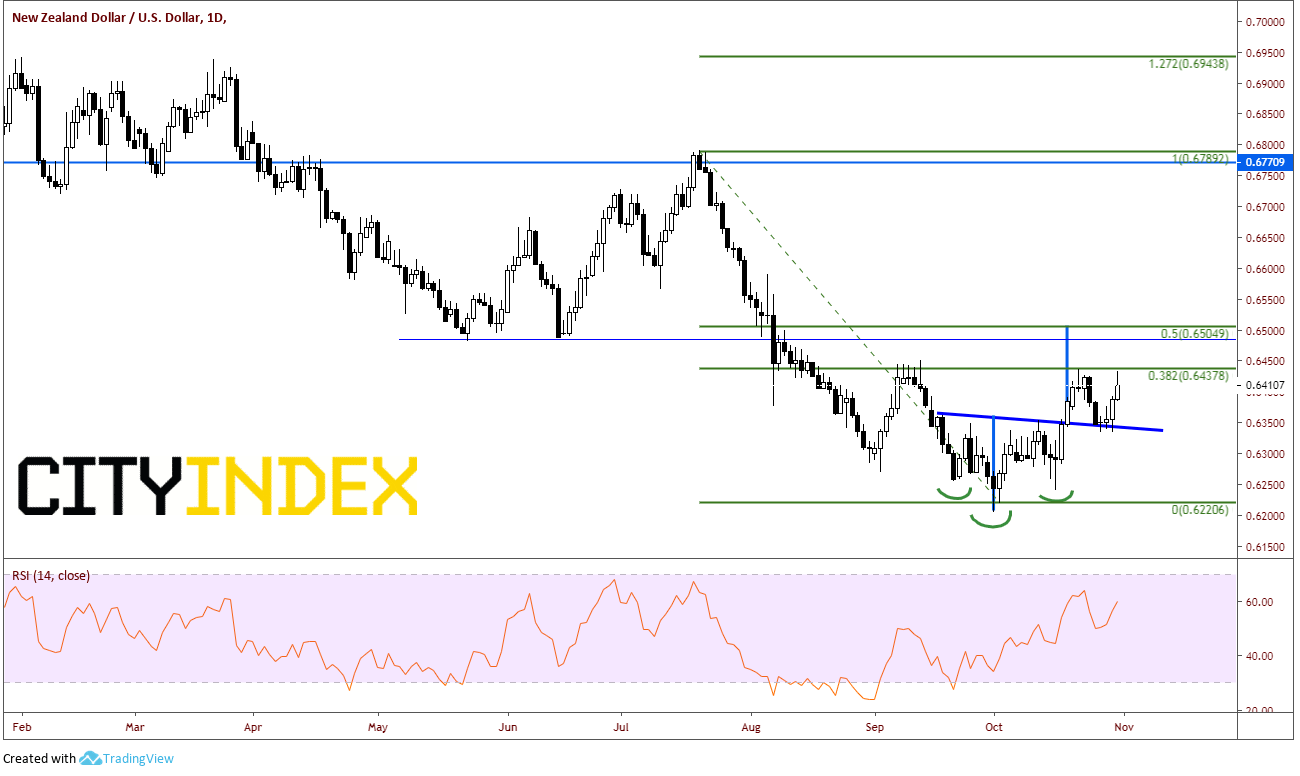
Source: Tradingview, City Index
Tomorrow’s payroll data and any more China-US headlines should provide the next direction for S&Ps and the AUD/USD and NZD/USD. A move above or below the resistance or support on the daily charts should provide longer-term direction.
Latest market news
Yesterday 03:00 PM
Yesterday 01:12 PM
Yesterday 11:14 AM
Yesterday 08:28 AM
April 24, 2024 03:30 PM
Latest Dollar articles
April 23, 2024 11:09 PM
April 18, 2024 06:20 AM
February 16, 2024 11:30 AM
February 7, 2024 03:30 PM