


May 25, 2021 1:18 AM
Rising commodity prices are viewed as a threat to China’s recovery and a cause of inflation. Premier Li in a State Council meeting urged the country to "effectively deal with the commodity price surge and its impact”.
The Chinese regulators verbal intervention has been well timed. Firstly to coincide with a loss of momentum in the global re-opening due to supply disruptions as well as downgrades to China 2021 GDP growth, following disappointing retail sales and industrial production data last week.
The threat of further jawboning and a slowdown in the reflation trade are unlikely to derail the longer term commodity super cycle.
However its threat should continue to create headwinds for commodity prices in the short term. Reflecting this the 62% Mysteel index fell another $9 overnight to $187.75, bringing losses from the May 12 high, to $45.95 or almost 20%.
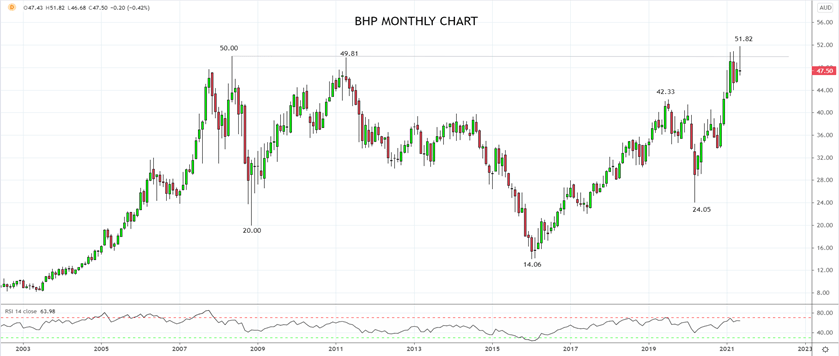
Australia’s big mining companies have clearly felt the impact of lower commodity prices. Over the past two weeks BHP Group (BHP) has fallen -10%, RIO Tinto (RIO) -10.3% and OZ Minerals (OZL) – 10.4%.
Despite a bounce in today’s session there is a loss of upside momentum evident in the mining stocks as viewed on the monthly chart of BHP Group below. Further consolidation in the short term would not surprise before a return to trend.
Learn more about trading shares here
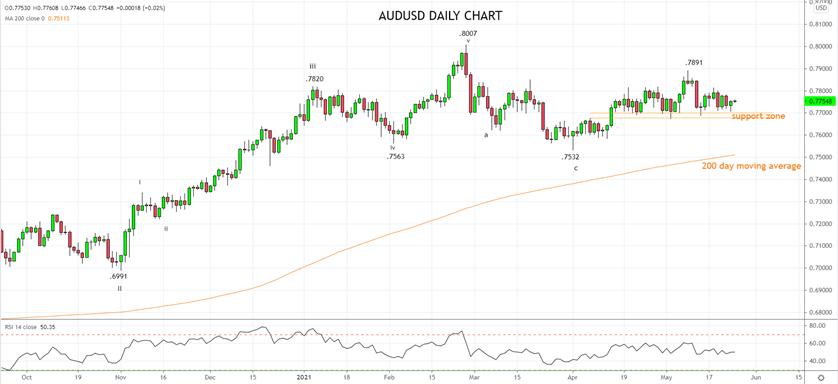
Turning to the currency market, the AUDUSD has been marked lower in recent sessions in sympathy with the fall in iron ore prices. However, with coal prices remaining buoyant, the AUDUSD has been able to hold above the support from the bottom of its five-week range at .7700/.7675.
It is likely that short-term traders will consider buying dips ahead of the .7700/.7675 support region. Aware that should the AUDUSD break below support at 7700/.7675 then the correction from the February .8007 high may deepen towards the April .7532 low and the 200 day moving average near .7510c.
Source Tradingview. The figures stated areas of the 25th of May 2021. Past performance is not a reliable indicator of future performance. This report does not contain and is not to be taken as containing any financial product advice or financial product recommendation
Latest market news
Yesterday 08:33 AM
Latest Commodities articles
April 17, 2024 03:02 AM
April 15, 2024 12:48 AM
April 14, 2024 11:37 PM