Charting Equities vs VIX 1 day after Warning
Yesterday’s note warned about a repeat of the April 2011 market top, using the anticipated strength in non-farm payrolls as a rationale to the obstacle […]
Yesterday’s note warned about a repeat of the April 2011 market top, using the anticipated strength in non-farm payrolls as a rationale to the obstacle […]
Yesterday’s note warned about a repeat of the April 2011 market top, using the anticipated strength in non-farm payrolls as a rationale to the obstacle to further Fed asset purchases. We warned that if Friday’s release of US jobs report shows the 3rd consecutive monthly reading of +200K in non-farm payroll, it would be a repeat of the last three consecutive months of +200K readings seen February- April 2011, a period coincided with the April 2011 peak in equities and oil. It also coincided with the final months of QE2. 11 months later, we may be seeing the same thing all over. Back-to-back NFP readings of +200K.
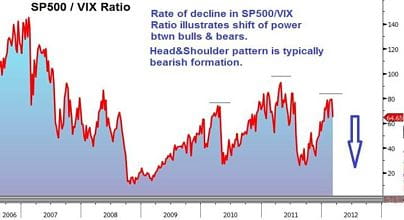
After yesterday’s fundamental rationalization, here is the technical take, focusing on equities. S&P500 Relative to VIX: A better measure of sentiment shift While observers usually focus on the S&P500 and the VIX individually, we assess the equity index relative to its own volatility index, which best captures the balance between the bulls and the bears. The technical developments in the SP500/VIX ratio illustrate a familiar and typically bearish pattern (head & shoulder formation). As such, the right shoulder signifies a failed attempt of the ratio to recapture the head (top of spring 2011). The significance is also highlighted by the fact that the failed recovery nearly matches the left shoulder, the high of early 2010.
S&P500/VIX Ratio
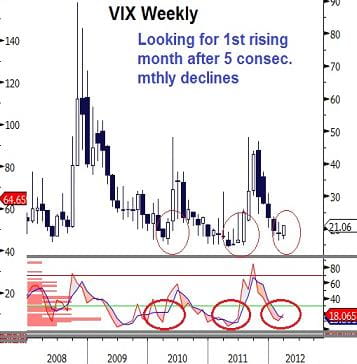
VIX Weekly
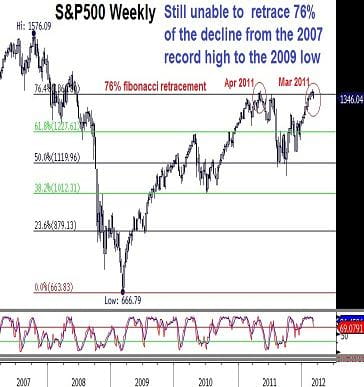
S&P500 once again fails to retrace 76% of the decline from its record high (October 2007) to those 13-year lows (March 2009). 76% is an important retracement level according to the Fibonacci pattern of mathematical progressions. (It is another way of highlighting ¾ retracements). This level stands at 1360 in the S&P500. The last time S&P500 failed the 76% recovery (1360) was in May 2011. Although the index did rise above 1360 back in 2011 and earlier this month, there were no sustainable weekly closes above this level. In the event that a double top is validated, we could see S&P500 extend losses towards 1227, before 1130.
S&P500 Weekly
Meanwhile, EURUSD breaks the 1.3200 support shown in yesterday’s charts (trendline extending from January low). This paves the way to 1.3055, which coincides with the 55 moving average and the 50% retracement of the rally from the Jan low to the February high. A strong NFP reading (above 200K) will likely trigger an all-round classic-USD rally resulting from robust US data.
