


July 28, 2021 11:52 AM
Canadian Inflation near expectations; Focus on Central Bank differences; USD/CAD
Canadian CPI for June was 3.1% YoY vs 3.2% expected and 3.6% last. In addition, the Core Rate of Inflation was 2.7% vs 2.6% expected and 2.8% last. The fall in the increase came from lower housing and transportation costs. Does this mean the Bank of Canada’s tapering to help lower inflation has been working? At the last BOC meeting, the central bank lowered their bond purchases (tapered) from C$3 billion per week to C$2 billion per week. They also tapered at their April 14th meeting. By reducing the number of bond purchases the BOC is buying per week, the BOC may be succeeding at keeping inflation lower than some of its counterparts, such as the US Federal Reserve. The BOC doesn’t meet again until September 8th.
Speaking of the Federal Reserve, the FOMC meets later today and is expected to leave monetary policy unchanged, despite having headline inflation of 5.4% and Core inflation of 4.5%! (See our FOMC Preview here). However, US Fed Chairman Powell has been saying that most of the current inflation is transitory, and therefore, tapering isn’t warranted. In addition, in his semi-annual testimony before Congress on the economy, Powell noted that “substantial further progress” hasn’t been achieved in the labor market. This is an additional reason for Powell to suggest no tapering at today’s meeting. The main question heading into today’s meeting is “When will they announce that tapering will begin?” The mostly likely answer is not today.
Everything you need to know about the Federal Reserve
USD/CAD had been moving lower in a descending wedge dating back to the pandemic highs of March 2020. However, on June 18th, the pair broke higher above the top, downward sloping trendline of the wedge near 1.2390 and continued moving higher. Since then, the pair has been trading higher in an orderly upward sloping channel. USD/CAD recently tested the top trendline of the channel and pierced horizontal resistance at 1.2748, before pulling back to test the bottom trendline of the channel and the 200 Day Moving Average near current levels at 1.2605.
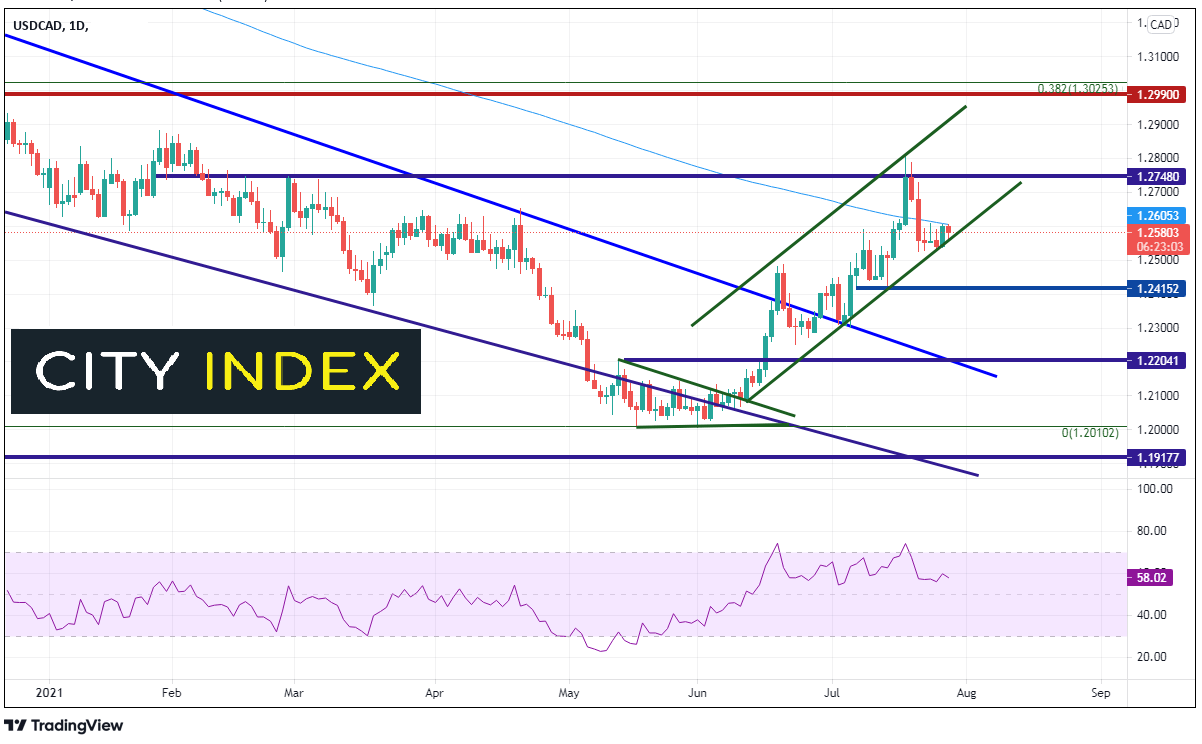
Source: Tradingview, City Index
Resistance above is at the July 19th highs of 1.2744, and then the top trendline of the channel, near 1.2900. Above there, horizontal resistance is at 1.2990. Support is at the confluence of the bottom trendline of the channel and July 24th lows between 1.2525 and 1.2556. Horizonal support below is at 1.2415 and then the confluence of the top, downward sloping trendline of the longer-term wedge and horizonal support near 1.2204.
If the BOC continues its tapering journey and the FOMC continues to be dovish, CPI may continue to fall in Canada while it continues to increase in the US. Today’s FOMC meeting may give us a clue as to when the announcement of when tapering will begin, however, USD/CAD may continue to move higher as long as the pair remains within the current channel.
Learn more about forex trading opportunities.
Latest market news
Yesterday 03:00 PM
Yesterday 01:12 PM
Yesterday 11:14 AM
Latest Forex articles
April 24, 2024 03:14 PM
April 24, 2024 11:00 AM
April 23, 2024 11:09 PM