


Tencent Holdings, a Chinese technology giant will report its Q3 earnings later today, 13 Nov after the close of the Hong Kong trading session at 2000 HKT.
Based on data from Thomson Reuters Refinitiv, analysts’ consensus mean estimate for Q3 revenue stands at CNY98.17 billion with EPS (earnings per share) at 2.56. These expectations translate to an increase in revenue growth (21% y/y) and EPS growth (4.9% y/y) from the same quarter a year ago.
Let’s us now take a look at the share price of Tencent Holdings from a technical analysis perspective. Tencent is also a key component stock (the 2nd largest in terms of market capitalisation) in the Hang Seng Index, Hong Kong stock market benchmark. (Click here to recap our previous update on Tencent).
Medium-term technical outlook on Tencent Holdings (0700 HKG)
click to enlarge charts
Key Levels (1 to 3 weeks)
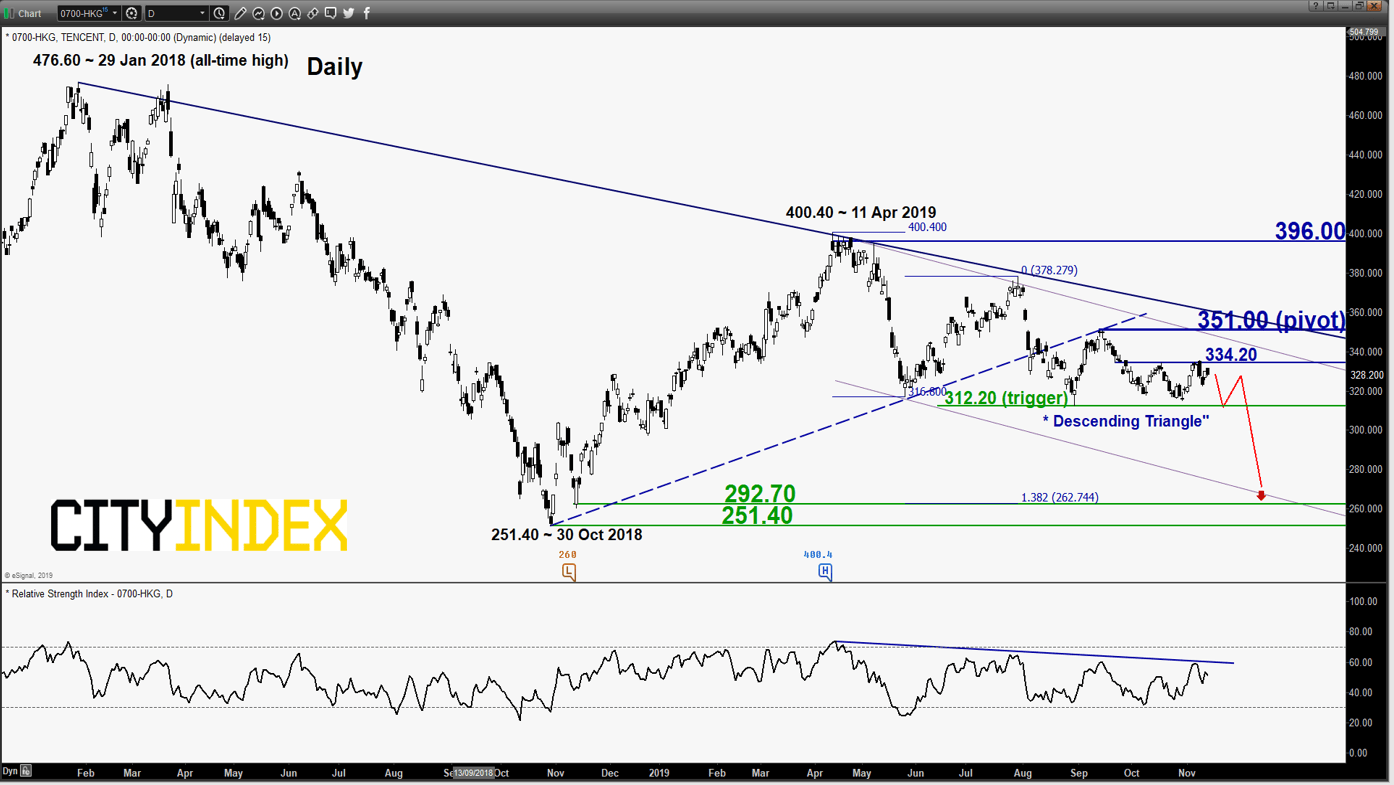
Intermediate resistance: 334.20
Pivot (key resistance): 351.00
Supports: 312.20 (trigger), 292.70 & 251.40
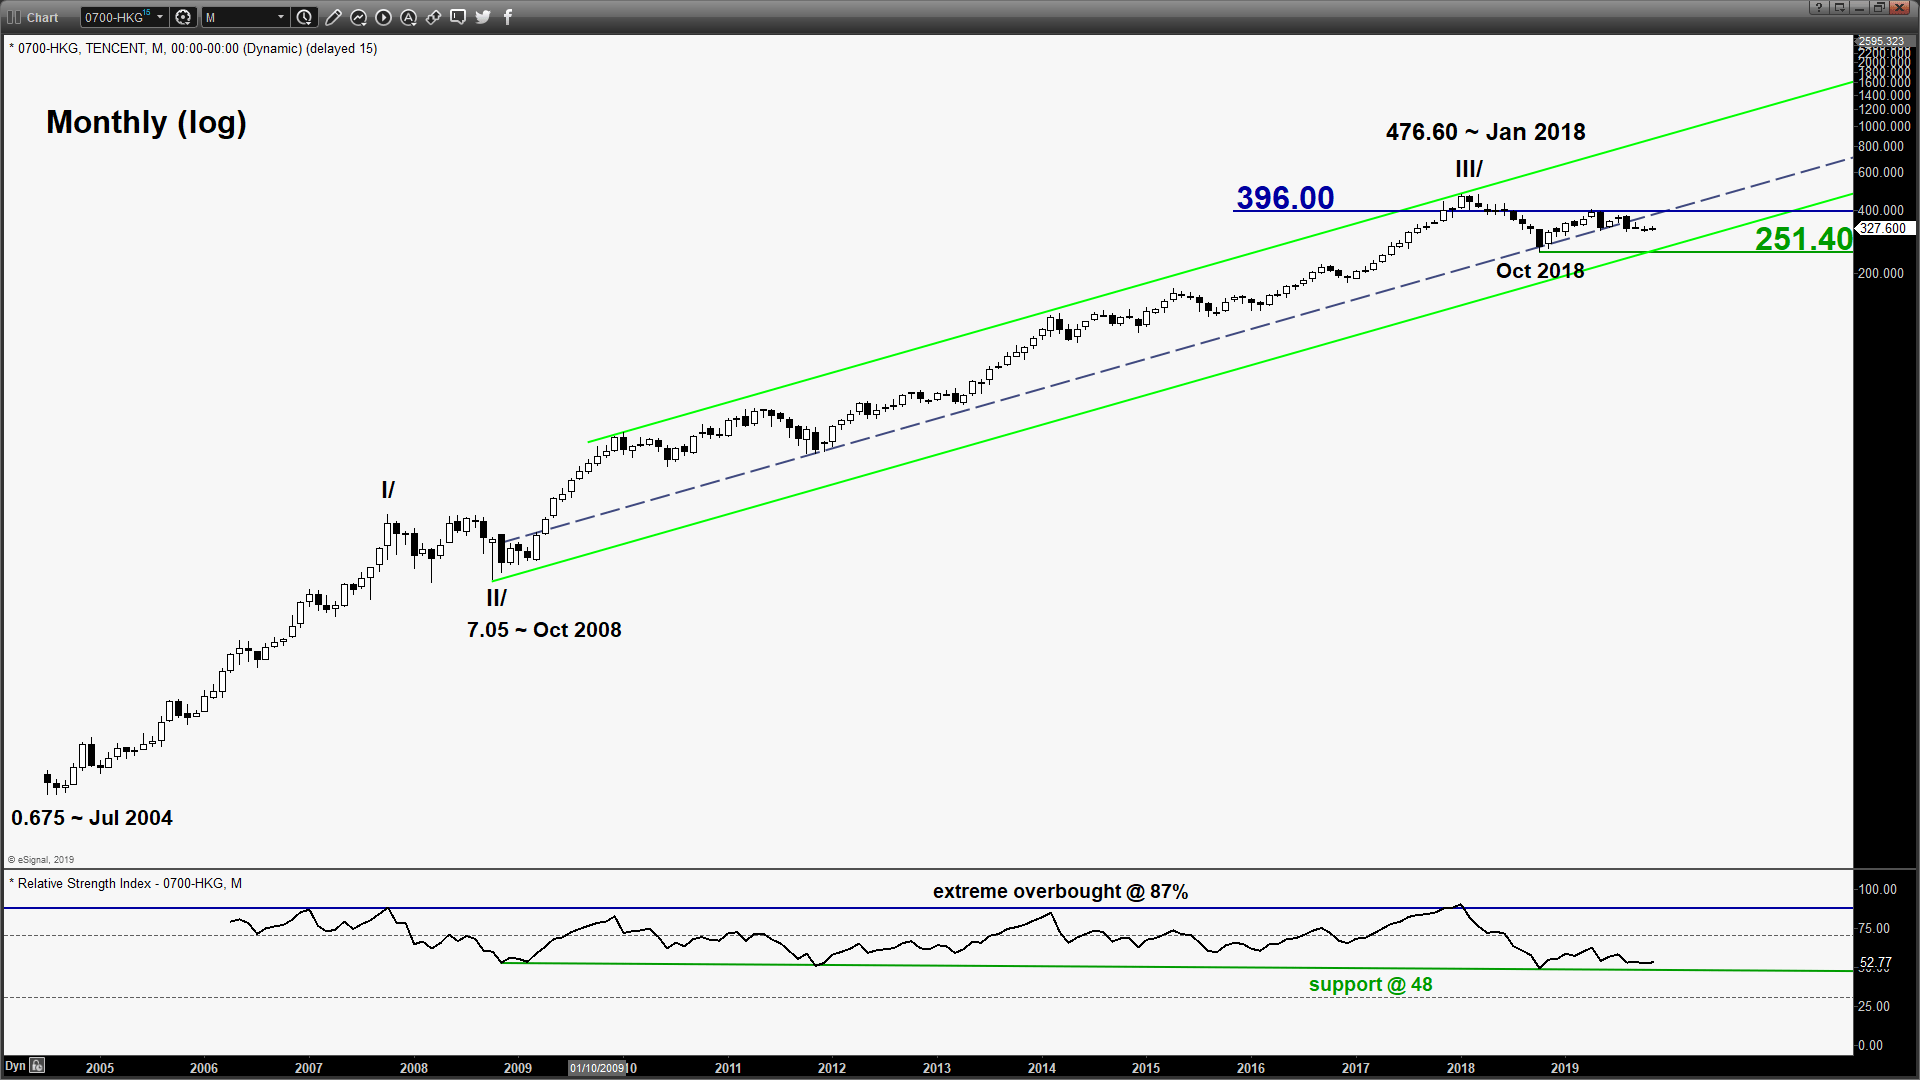
Next resistance: 396.00
Directional Bias (1 to 3 weeks)
Bearish bias below 351.00 key medium-term pivotal resistance and adjusted the downside trigger level to 312.20 (the “Hammer” candlestick low of 29 Aug 2019). A break below 312.20 is likely to open up scope for a potential multi-week corrective decline to target the next support at 292.70 with a maximum limit set at 251.40 (30 Oct 2018 swing low & the lower boundary of a long-term secular ascending channel from Oct 2008 low).
On the other hand, a clearance with a daily close above 351.00 negates the bearish pressure for a push up towards the major range resistance at 396.00.
Key elements
- Since its low of 316.80 printed on 27 May 2019, the share price of Tencent has been evolving within a “Descending Triangle” range configuration where it has traced out a series of “higher lows” which indicates the lack of bullish conviction.
- The daily RSI oscillator has remained below a corresponding descending resistance at the 60 level which indicates medium-term upside momentum has not resurfaced.
- The 292.70 support is defined by the lower boundary of a medium-term descending channel from 11 Apr 2019 high and the 1.382 Fibonacci expansion of the slide from 11 Apr high to 27 May 2019 low projected from 30 Jul 2019 high.
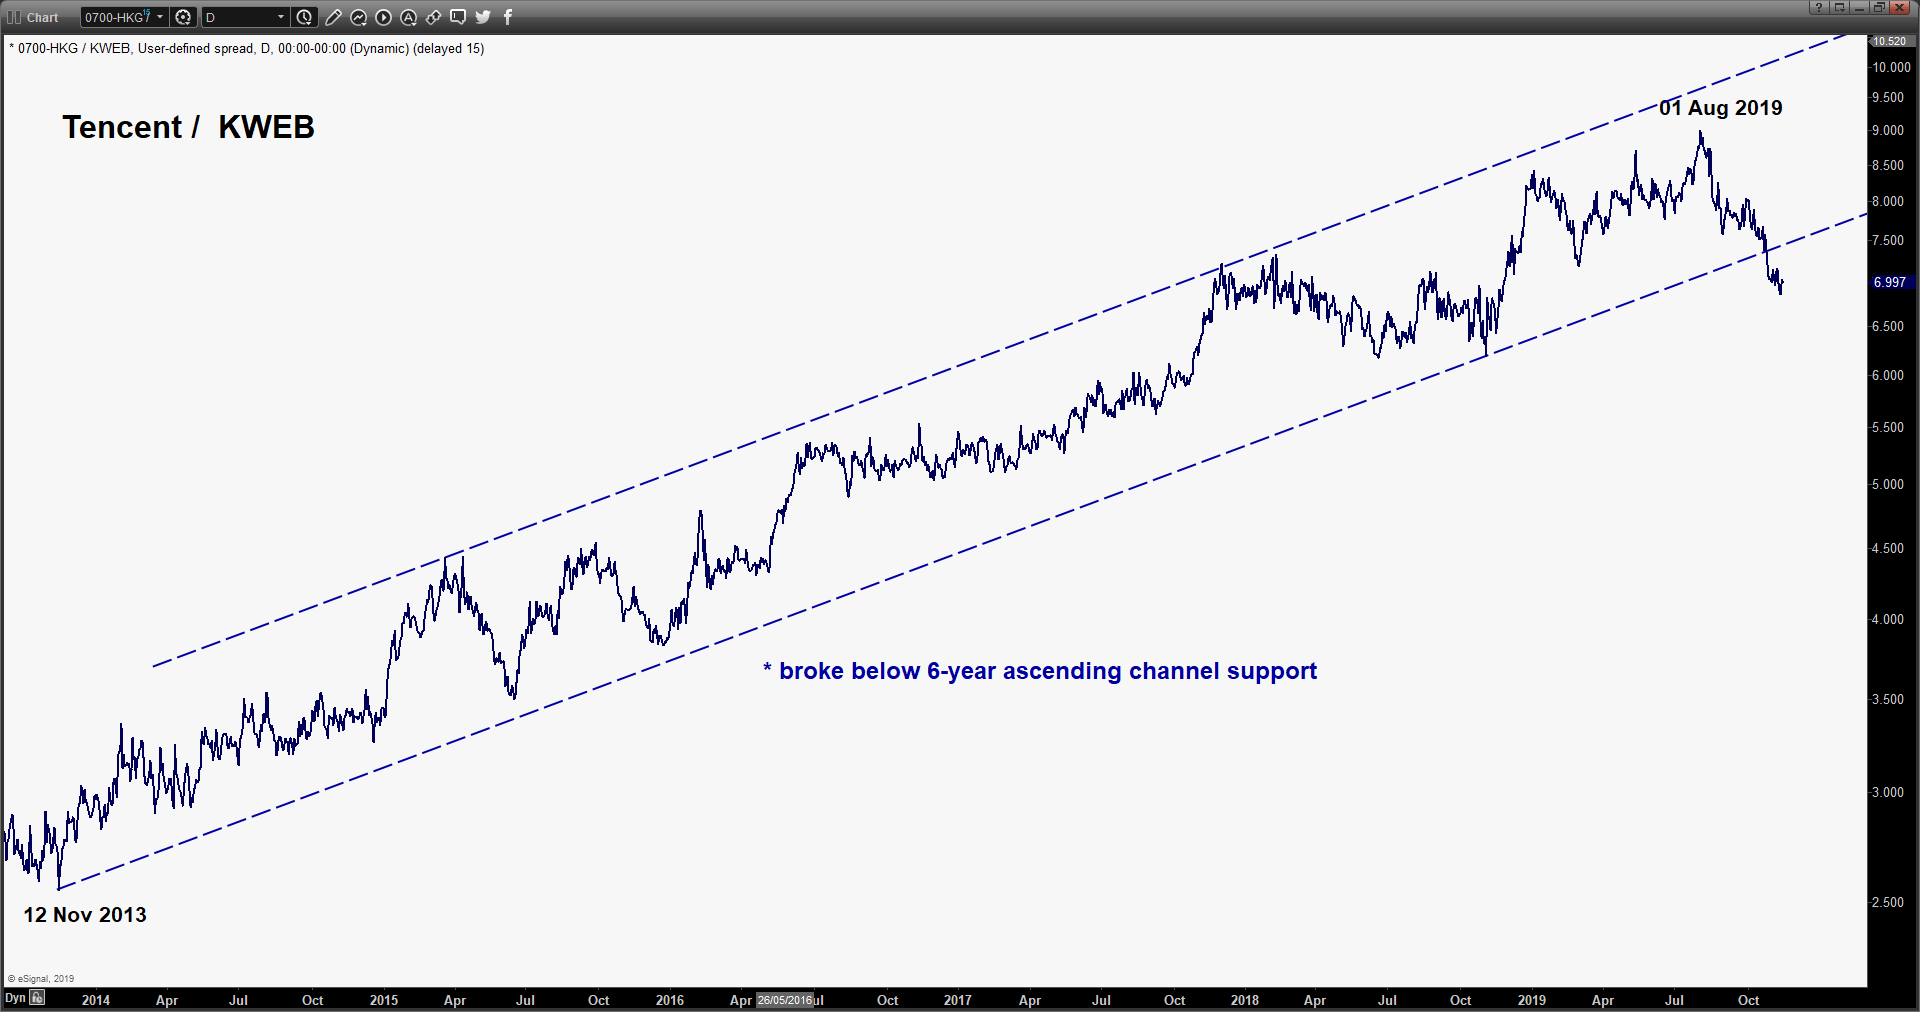
- Relative strength analysis as indicated by the ratio chart of Tencent against KWEB, an ETF listed in NYSE that comprises a basket of publicly traded China-based firms whose primary businesses are in the internet and e-commerce related sectors is showing underperformance of Tencent. This observation increases the odds of further downside pressure in the share price of Tencent.
Charts are from eSignal
Latest market news
Yesterday 11:48 PM
Yesterday 11:16 PM
Yesterday 05:00 PM
Yesterday 01:13 PM
Yesterday 11:00 AM
Latest Tech Stocks articles
October 19, 2023 09:47 AM
October 18, 2023 12:06 PM
October 11, 2023 02:41 PM
October 3, 2023 12:24 PM