


Alphabet Inc, the holding company of Google will report its Q3 2019 earnings on Mon, 28 Oct after the close of the U.S. session. Consensus adjusted EPS and revenue forecasts are pegged at $14.59 and $23.72bn respectively. My colleague, Ken Odeluga has written an earnings preview report earlier (click here for a recap).
We will now decipher the share price of Alphabet from a technical analysis perspective.
Medium-term technical outlook on Alphabet (GOOGL)

click to enlarge charts
Key Levels (1 to 3 weeks)
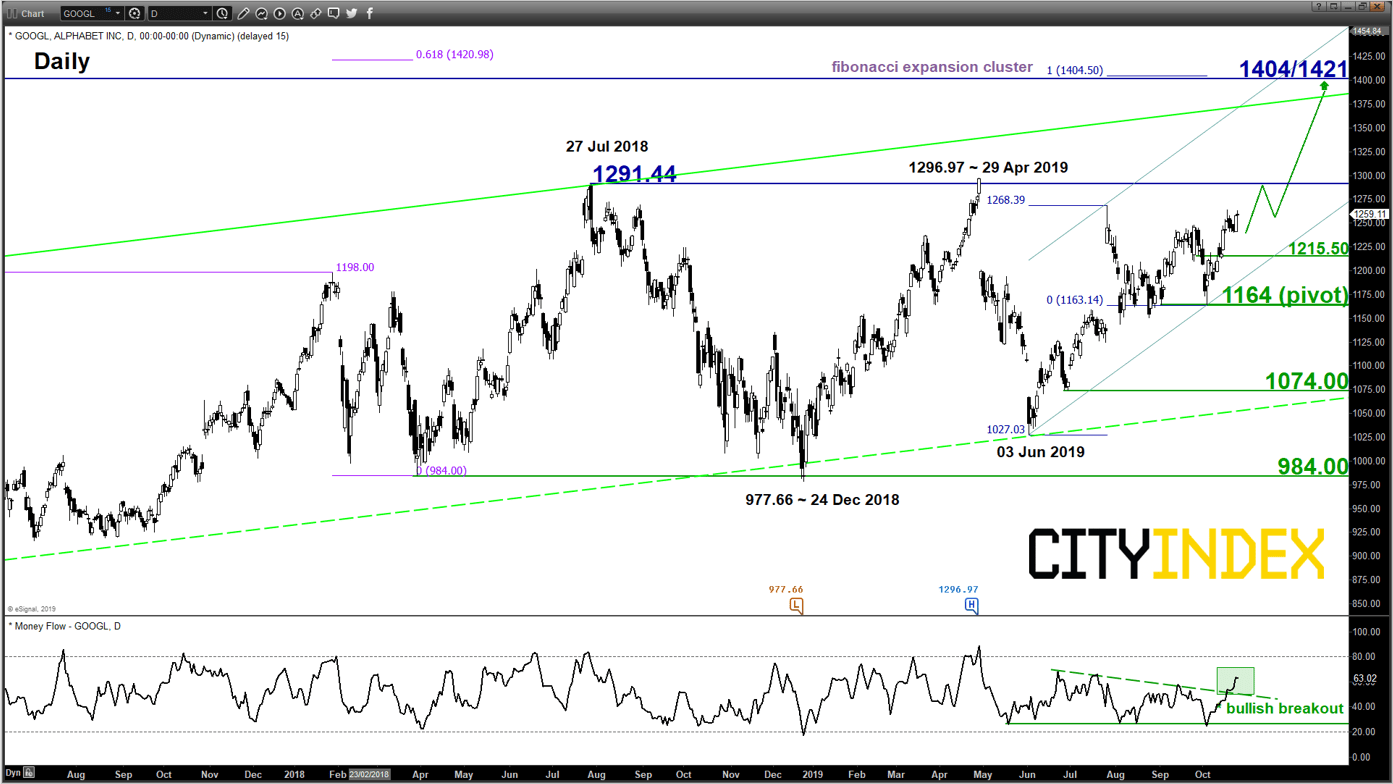
Intermediate support: 1215.50
Pivot (key support): 1164
Resistances: 1291.44 & 1404/1421
Next support: 1074
Directional Bias (1 to 3 weeks)
Bullish bias in any dips above 1164 key medium-term pivotal support and a clearance above 1291.44 is likely to open up scope for another potential impulsive upleg sequence to target the next significant major resistance zone at 1404/1421.
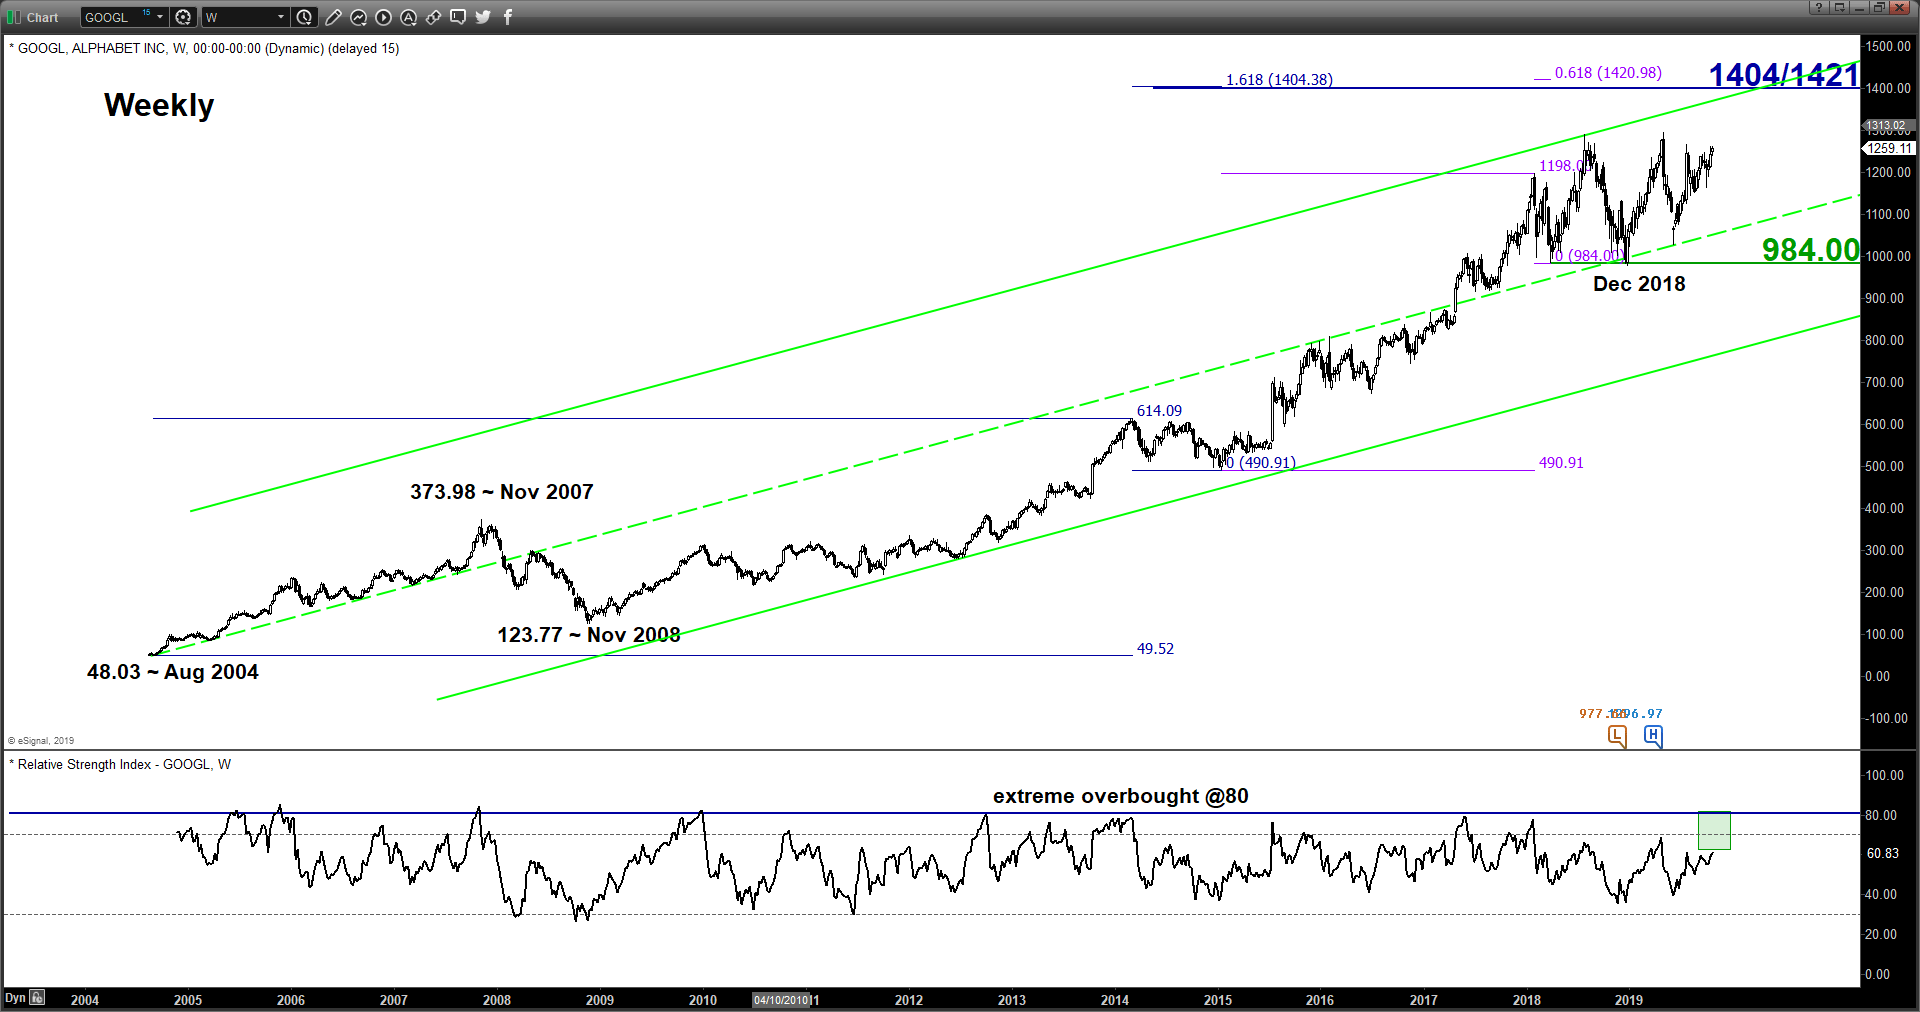
On the other hand, a break with a daily close below 1164 put the bullish tone on hold for a corrective slide to retest the upper limit of a major support zone at 1074.00 (the median line of a long-term secular ascending channel from Aug 2004 low & 76.4% Fibonacci retracement of the up move from 03 Jun low to 26 Jul 2019 high.
Key elements
- The weekly RSI oscillator has continued to inch upwards since Jun 2019 and still has room to manoeuvre to the upside before it reaches an extreme overbought level at 80.
- The daily Money Flow Index (MFI) has staged a bullish breakout and has not reached its overbought region where its measurement is derived from a combination of price action and volume. Thus, observations from RSI and MFI suggest that both volume and upside momentum has started to pick up which supports a potential bullish breakout from its 15-month range configuration in place since 27 Jul 2018.
- Relative strength analysis against the market (S&P) and its sector (Communication Services) as infer from the ratio charts (refer to the last chart) are suggesting potential outperformance of Google/Alphabet against its Communication Services sector.
- The major resistance zone of 1404/1421 is defined by the upper boundary of the long-term secular ascending channel that confluences with upper boundary of the medium-term ascending channel from 03 Jun 2019 low and a Fibonacci expansion cluster.
Charts are from eSignal
Latest market news
Yesterday 03:00 PM
Yesterday 01:12 PM
Yesterday 11:14 AM
Latest Google articles
July 31, 2023 03:03 PM
May 15, 2023 02:29 AM
July 1, 2022 07:15 AM
May 11, 2022 07:45 AM