CAC stocks vulnerable as Greek default fears intensify
The major European stock indices have gapped lower at the open and are in danger of suffering further declines this week. That’s because, as things […]
The major European stock indices have gapped lower at the open and are in danger of suffering further declines this week. That’s because, as things […]
The major European stock indices have gapped lower at the open and are in danger of suffering further declines this week. That’s because, as things stand, Greece is heading for a potential default and an exit from the euro zone. It is likely that not even half of this “Grexit” risk is priced it, which makes equities and the euro particularly vulnerable should the unthinkable happen. Another round of talks between Greece and its creditors yielded no result at the weekend as both parties failed arrive at a common ground in this protracted bailout negotiations. Although some progress has been made, according to a European Commission spokesman “significant gaps” remain between the demands from Greece and EU/IMF.
The markets are likely to be driven chiefly by headlines regarding Greece this week, which means higher levels of volatility should be expected with the next Eurogroup meeting scheduled for Thursday. In addition to Greece, there will be plenty of other high-impact fundamental factors that should be followed closely too. The ECB President Draghi is due to testify on monetary policy before the European Parliament’s Economic and Monetary Affairs Committee, in Brussels, later this afternoon, followed by the result of the latest German ZEW Economic Sentiment survey on Tuesday and the FOMC statement on Wednesday.
Technical outlook
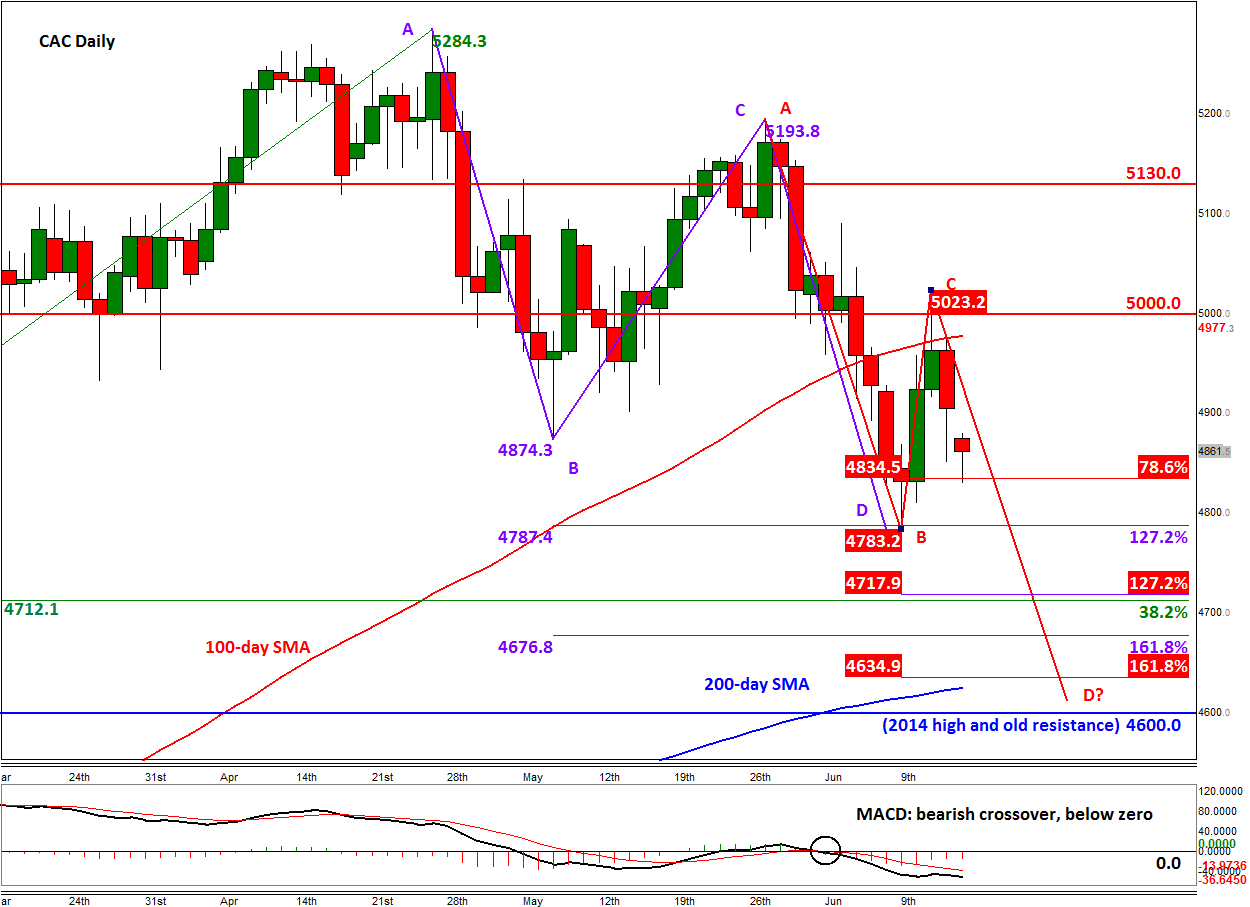
Among the major European markets, the French CAC has been one of the most technically-friendly indices of late. It has already completed an AB=CD pattern (depicted in purple) inside a long-term bullish trend on Tuesday of last week. But the corresponding rally from point D (4783) failed to get past the psychologically-important level of 5000 on Thursday and the selling pressure from there caused the index to close below the 100-day moving average (4977). The bulls had another attempt to take out the 100-day SMA on Friday but their attempts proved futile amid the on-going Greece saga.
Now, another AB=CD move could be under way (as depicted in red on the chart). Points A, B and C are already created, so to get to point D (4611) the CAC will first need to penetrate below point B (4783). So far however the 78.6% Fibonacci retracement of the BC move is holding firm at 4835, which roughly corresponds with today’s low (4830). But the path of least resistance is clearly to the downside now and it wouldn’t take much to for the index to drop further lower.
It is interesting to note that point D of the developing AB=CD move comes in around an area where several other technical factors also converge. These include the 200-day moving average at 4625; the 161.8% Fibonacci extension level of the BC swing at 4635, and the previous resistance and the 2014 high of 4600. Thus, depending on the market sentiment at that time – and assuming the index will get there in the first place – we could see a decent bounce from around point D, just like we did last time. But there are several other technical levels ahead of point D that could also turn into support – such as the Fibonacci levels shown on the chart. Among these Fibonacci levels, the 38.2% retracement at 4712 of the rally from the October 2014 low is the key one.
Meanwhile on the upside, the key resistance level to watch is that psychological 5000 mark. As things stand, a closing break above here is needed to effectively end the near-term bearish trend.