British Pound vs US Dollar Stalls Precipitous Decline Above Support
GBP/USD (daily chart) as of January 21, 2013 has tentatively stalled its plummet of the past week just above key support in the 1.5825 price […]
GBP/USD (daily chart) as of January 21, 2013 has tentatively stalled its plummet of the past week just above key support in the 1.5825 price […]
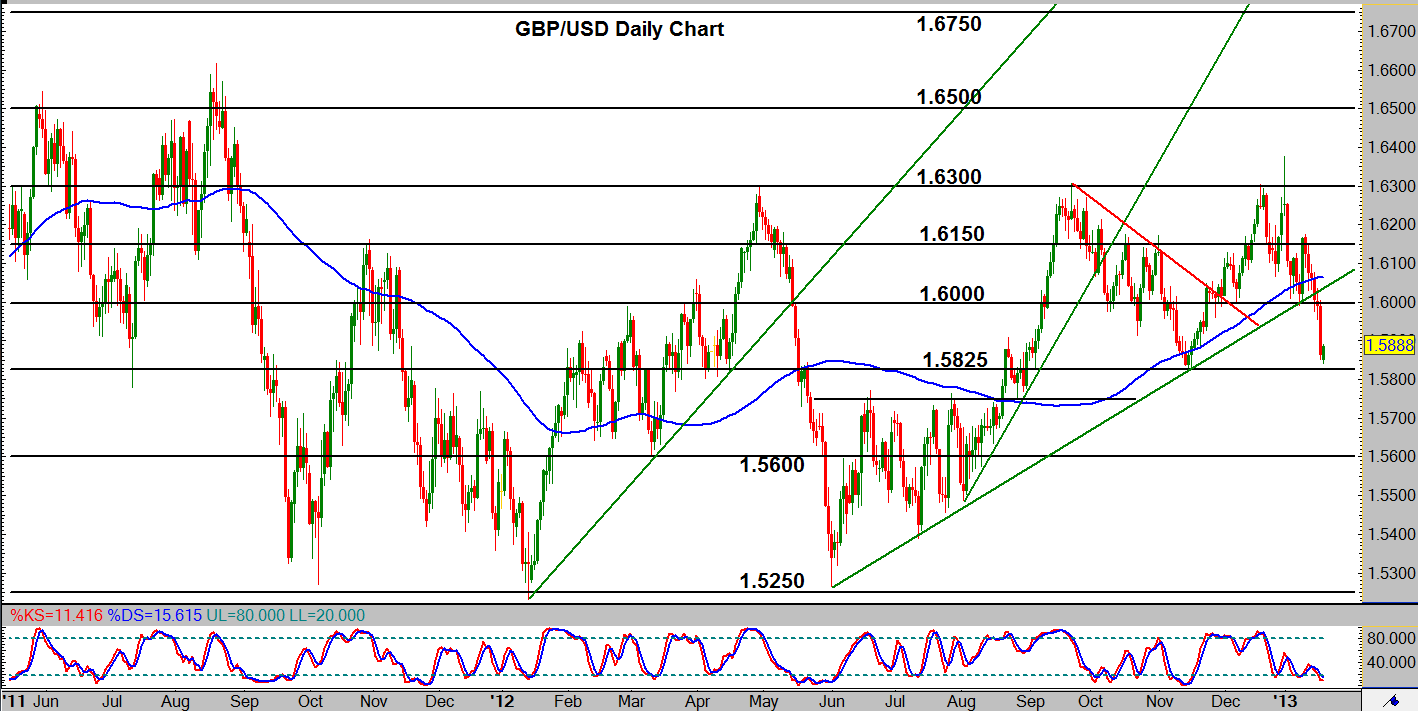
GBP/USD (daily chart) as of January 21, 2013 has tentatively stalled its plummet of the past week just above key support in the 1.5825 price region, last hit in mid-November 2012. Last week’s sustained fall broke down below both the important 1.6000 support level as well as a strong uptrend support line that was respected at least six times since it was initiated at the June 2012 low just above 1.5250. That support breakdown can be considered a major price event for the pair, as it signalled at least a disruption of the previously prevailing bullish trend. Prior to the breakdown, the pair was unable to breakout significantly above the 1.6300 resistance level, as price formed a fourth top with a shooting star candle right around 1.6300 in the very beginning of the year. This failure to breakout to the upside resulted in the subsequent bearish stance. With potential resistance now at 1.6000 (prior support), in the event of a breakdown below the 1.5800-1.5825 price region, the pair could extend its downside correction towards further potential support around the 1.5600 price region.