British pound vs US dollar stalls at triple top resistance
GBP/USD (daily chart) as of December 20, 2012, has stalled at a rough triple top resistance around the 1.6300 price region. The first top was […]
GBP/USD (daily chart) as of December 20, 2012, has stalled at a rough triple top resistance around the 1.6300 price region. The first top was […]
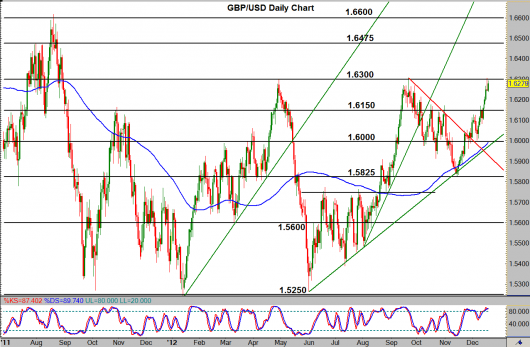
GBP/USD (daily chart) as of December 20, 2012, has stalled at a rough triple top resistance around the 1.6300 price region. The first top was established in April, then re-tested and respected in September, and finally re-tested and respected once again yesterday with a slight shooting star candle retreat.
Since yesterday, the price has made up for some of that retreat, with the price once again advancing to approach the 1.6300 level. This occurs within the context of a strong overall bullish trend extending back to the June 1.5266 low. It also occurs in the midst of a steep bullish trend that has been in place for the last two weeks.
If the pair is able to further this bullish trend with a significant breakout above 1.6300, which would confirm an uptrend continuation, the price could move towards further potential resistance around the 1.6475-1.6500 price region. If the price once again respects the 1.6300 level with a retreat to the downside, key potential support on a bearish correction resides around the important 1.6150 price region.