British Pound vs US Dollar Retreats from Key Resistance
GBP/USD (daily chart) as of November 26, 2012 has made a tentative turn back to the downside after making substantial gains for the past week […]
GBP/USD (daily chart) as of November 26, 2012 has made a tentative turn back to the downside after making substantial gains for the past week […]
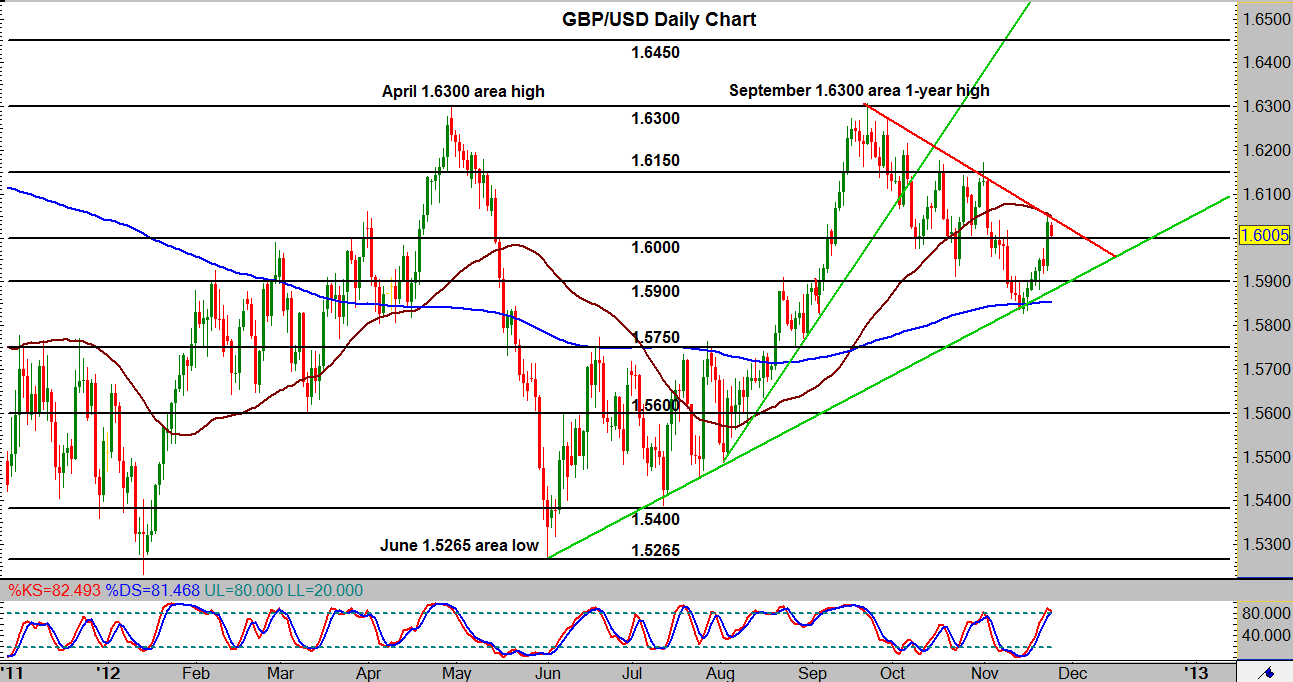
GBP/USD (daily chart) as of November 26, 2012 has made a tentative turn back to the downside after making substantial gains for the past week and a half. This tentative bearish retracement occurs after the price rose up to hit a key resistance confluence at both the 50-day moving average and the important downtrend resistance line extending back to the September 1.6300 area high. A week and a half ago, price turned to the upside after hitting a support confluence that consisted of both the 200-day moving average and the important uptrend support line extending back to the June 1.5265 area low. Therefore, GBP/USD can be seen as being within the confines of a two-month bearish correction of a six-month bullish trend. In the event that price continues its turn to the downside off the noted resistance confluence, an important potential support level to watch is 1.5900, as it is both a key prior support/resistance level as well as in the current vicinity of the six-month bullish support trend line. Any breakdown below that level could move towards 1.5750. To the upside, on any breakout above the noted resistance confluence, the next major resistance level to the upside potentially resides around the 1.6150 level.